A lux meter measures how bright light looks to the human eye. Your body clock runs on a different receptor: melanopsin in the intrinsically photosensitive retinal ganglion cells (ipRGCs). Its sensitivity peaks near 490 nm, while daytime vision peaks at 555 nm. That is why 300 lx from a warm incandescent lamp and 300 lx from a cool white LED act on the body differently, while the lux meter shows the same number for both.
The calculator on this page closes that gap. It takes the spectrum of your light source, resamples it to 380–780 nm in 1 nm steps, weights it with the five α-opic functions of CIE S 026 and returns the quantities used in circadian lighting requirements: melanopic EDI, melanopic DER, EML, CS/CLA 2.0 and a predicted melatonin suppression. Below you will find how to use it, what every number means, how much blue light before bed is actually too much, and what the best light for sleep looks like in figures rather than slogans.
Quick start: five steps
- Pick a spectrum. The «Presets» tab holds 16 CIE reference sources. If you have your own spectrum, use «Your data»: paste a table or drop a file.
- Set the level at the eye. In «Lux» mode this is the vertical illuminance at eye level, measured in the direction of gaze.
- Enter age and duration. Defaults are 32 years (the CIE standard observer) and 1 hour.
- Read the headline number. Melanopic EDI in lux and its position on the scale: sleep, evening, day.
- Check the target table. The «needed at the eye» columns tell you what illuminance this particular spectrum has to reach.
How to read the results
The headline number and the scale
Melanopic EDI (mel-EDI) is the illuminance of D65 daylight that would act on melanopsin exactly as your light does. The unit is the lux, but it is not the lux your meter shows.
Under the number sits a logarithmic scale with four zones:
- sleep ≤ 1 lx — the bedroom at night;
- evening ≤ 10 lx — the three hours before bed;
- day ≥ 250 lx — the daytime target;
- 136 lx — WELL v2 L03 tier 1.
The solid triangle on top is your value, the hollow triangle below is the age-corrected one.
Six key figures
Illuminance is what the lux meter reads.
Melanopic DER is the ratio of melanopic EDI to illuminance in lux. It is the key number of a spectrum and does not depend on the level, so you can do the arithmetic in your head: EDI = lx × DER.
| Source | DER | Lux needed for 250 lx EDI | Evening limit of 10 lx EDI |
|---|---|---|---|
| Pure blue 450 nm | 15.1 | 17 | 0.66 |
| Blue-red grow light 450/660 nm | 5.67 | 44 | 1.76 |
| D65 daylight | 1.000 | 250 | 10.0 |
| LED 6590 K (LED-B5) | 0.855 | 292 | 11.7 |
| LED 4100 K (LED-B3) | 0.632 | 395 | 15.8 |
| Metal halide (HP4) | 0.567 | 441 | 17.6 |
| Fluorescent 4000 K (FL11) | 0.563 | 444 | 17.8 |
| Incandescent (A, 2856 K) | 0.496 | 504 | 20.2 |
| White + red (LED-BH1) | 0.412 | 607 | 24.3 |
| LED 2730 K (LED-B1) | 0.406 | 615 | 24.6 |
| High-pressure sodium (HP1) | 0.155 | 1,610 | 64.4 |
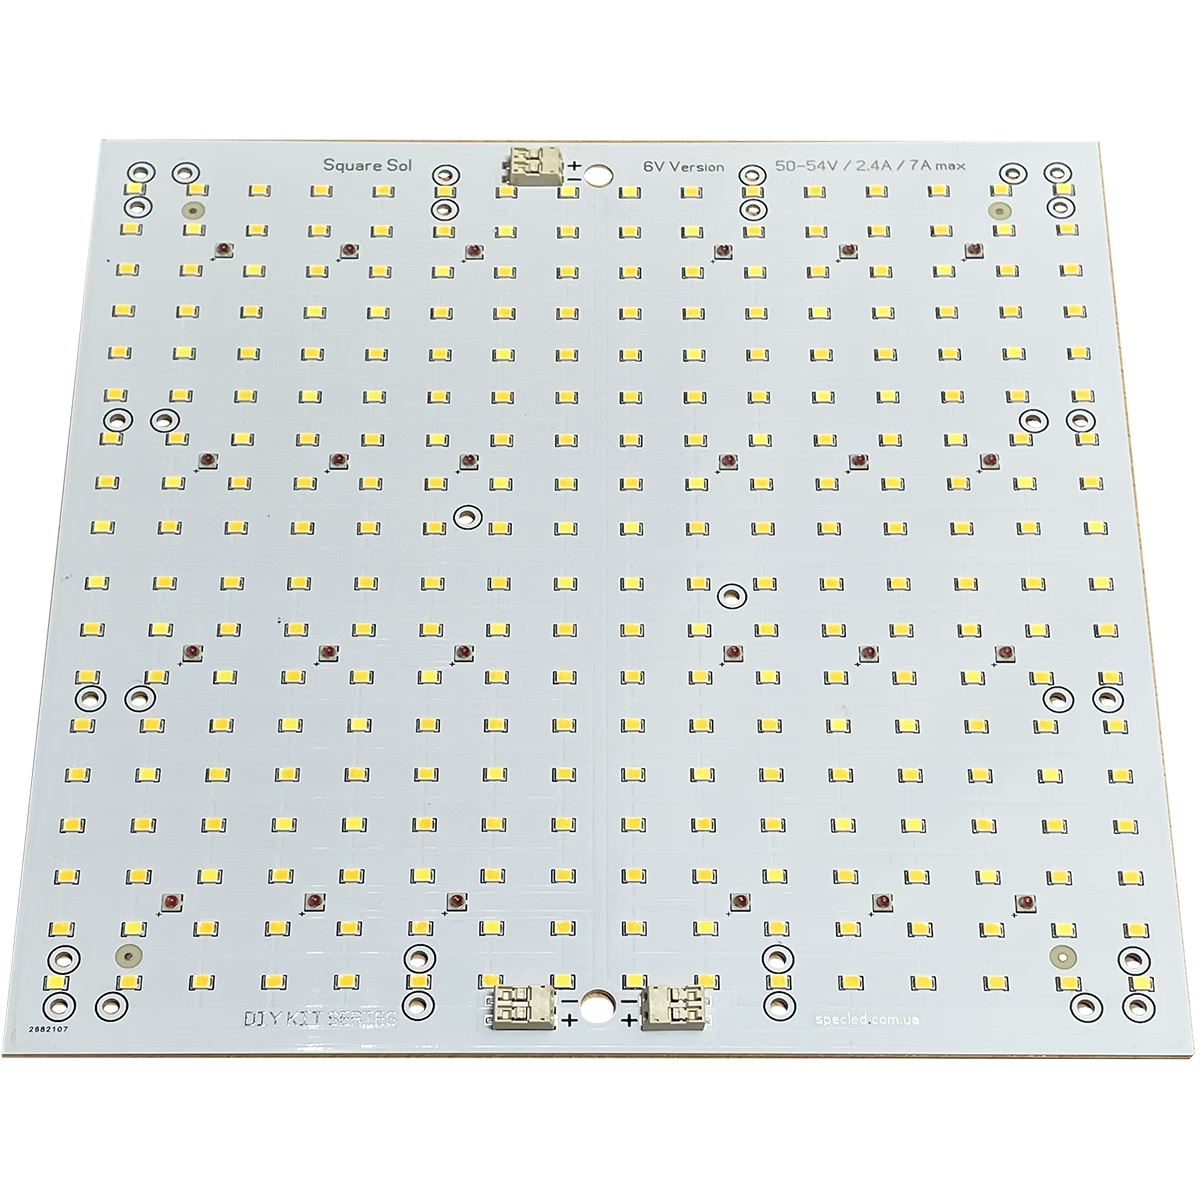
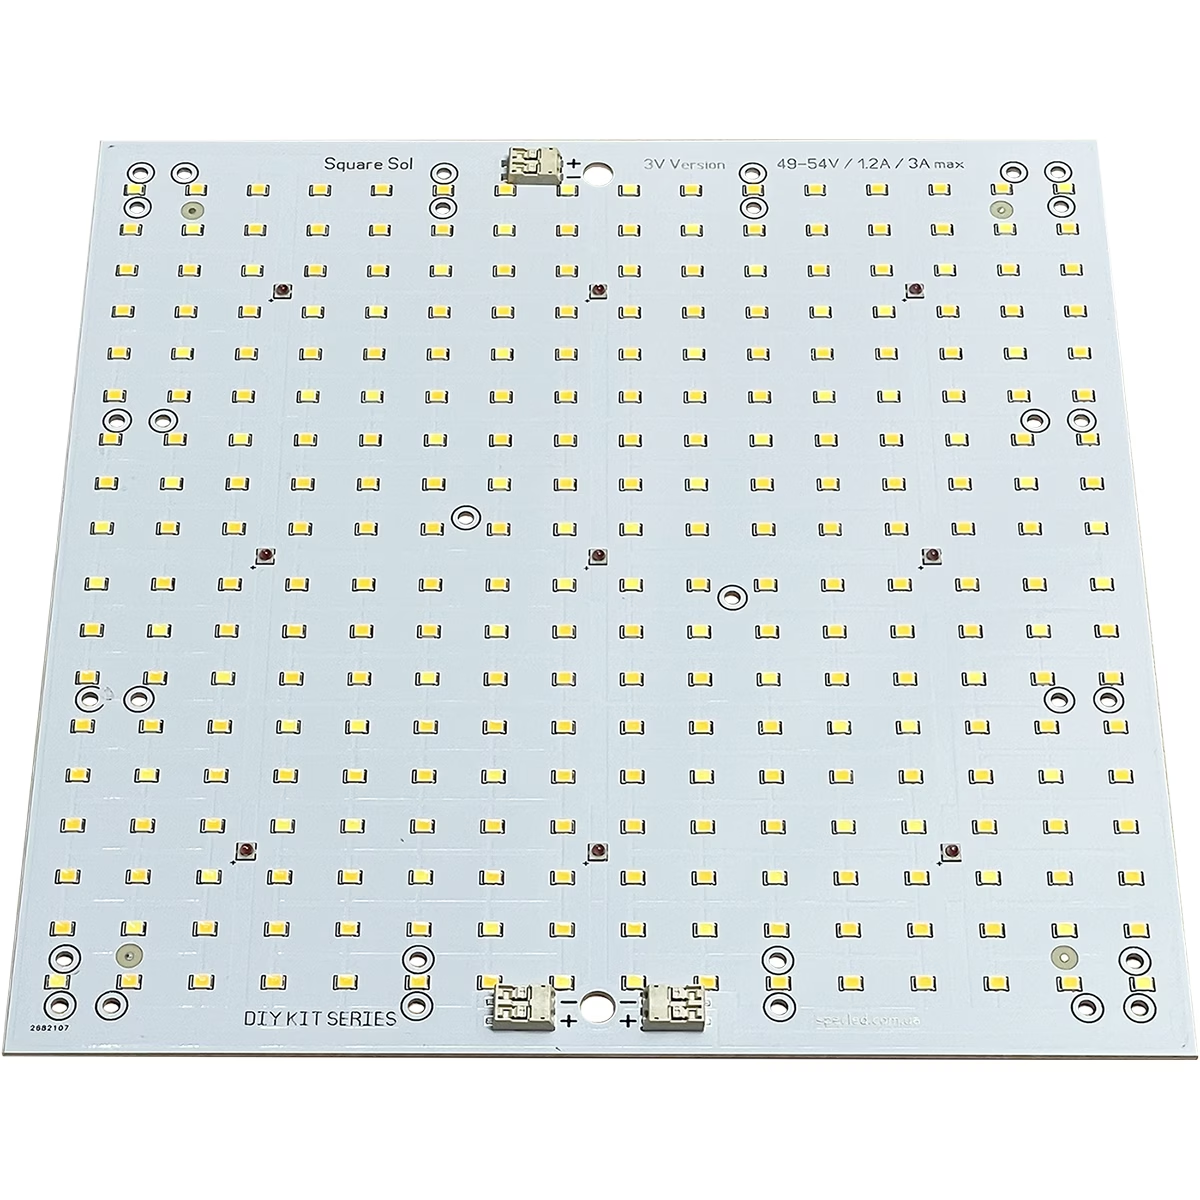
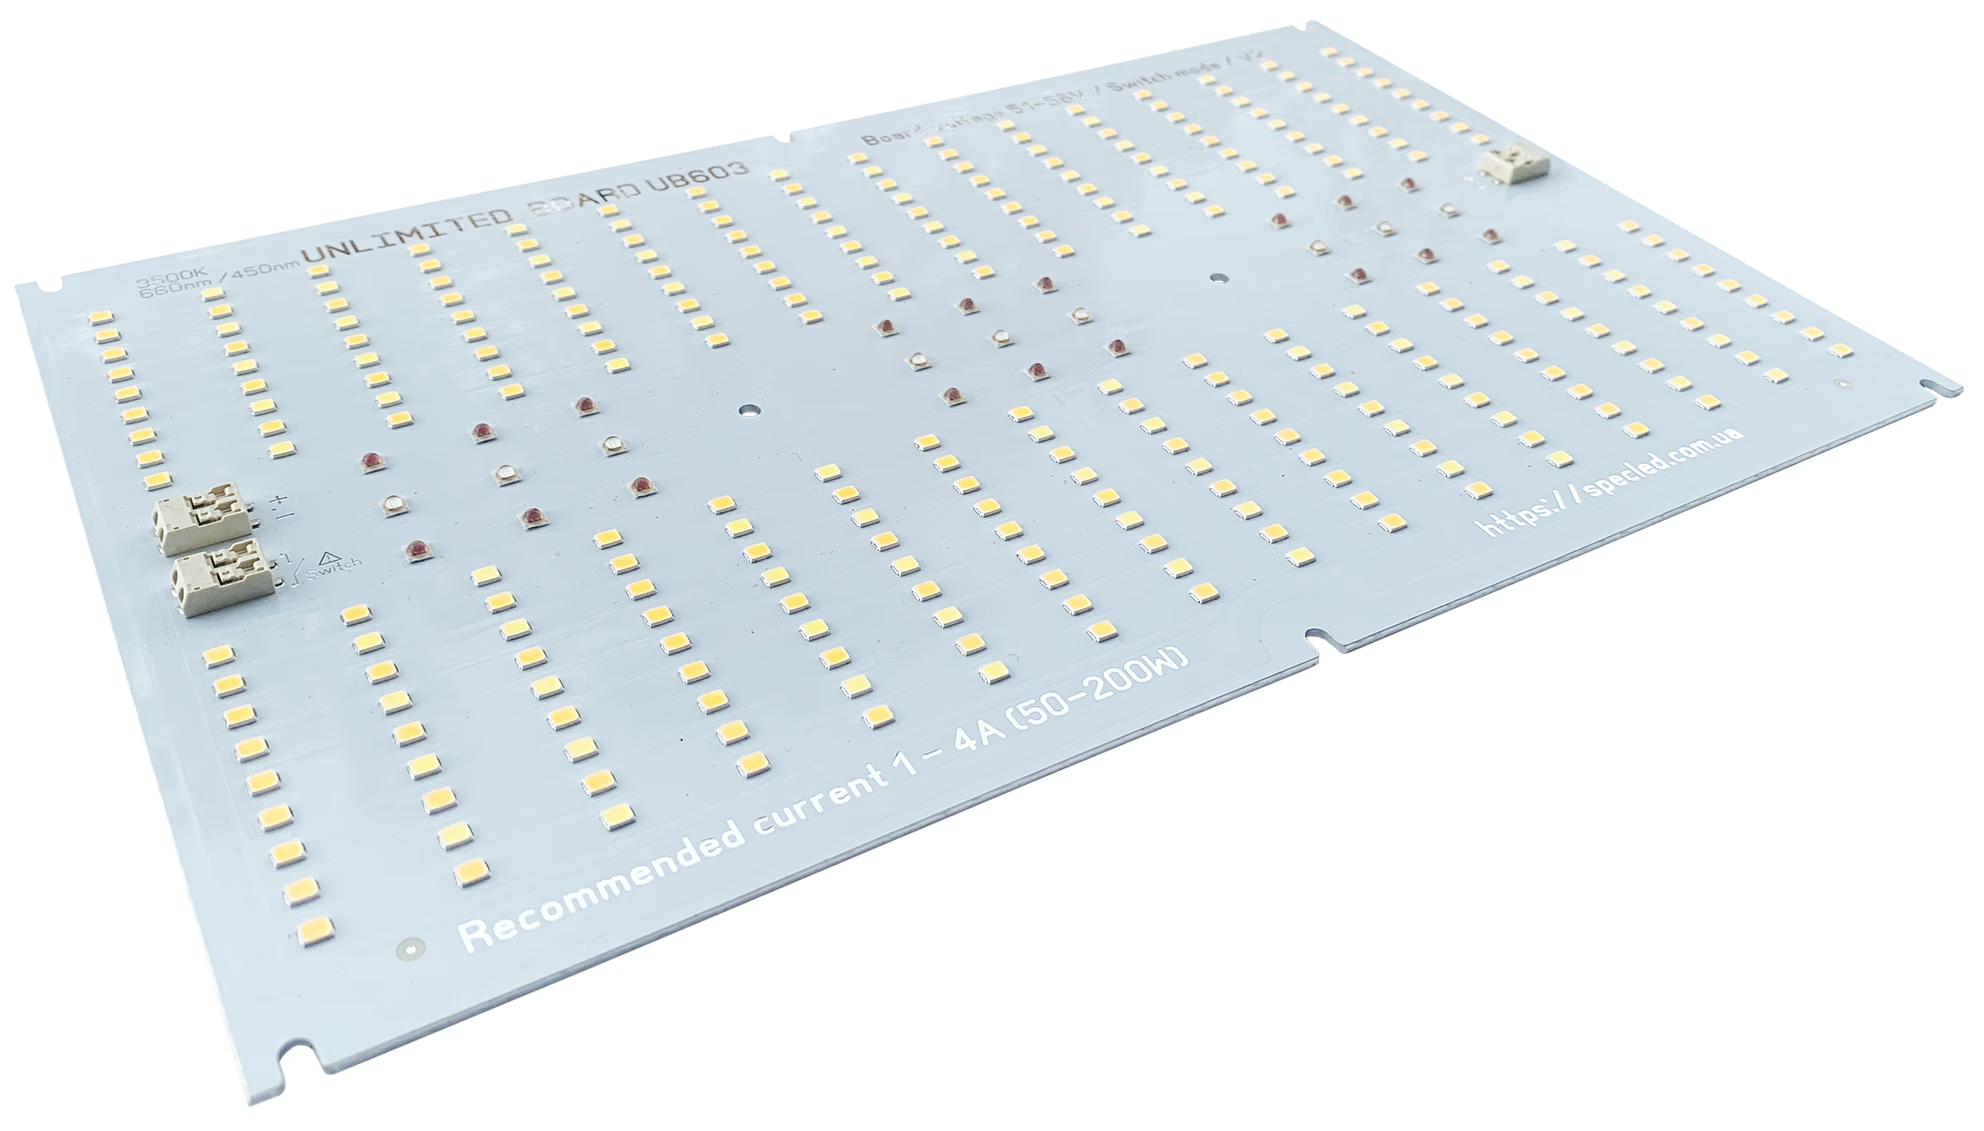
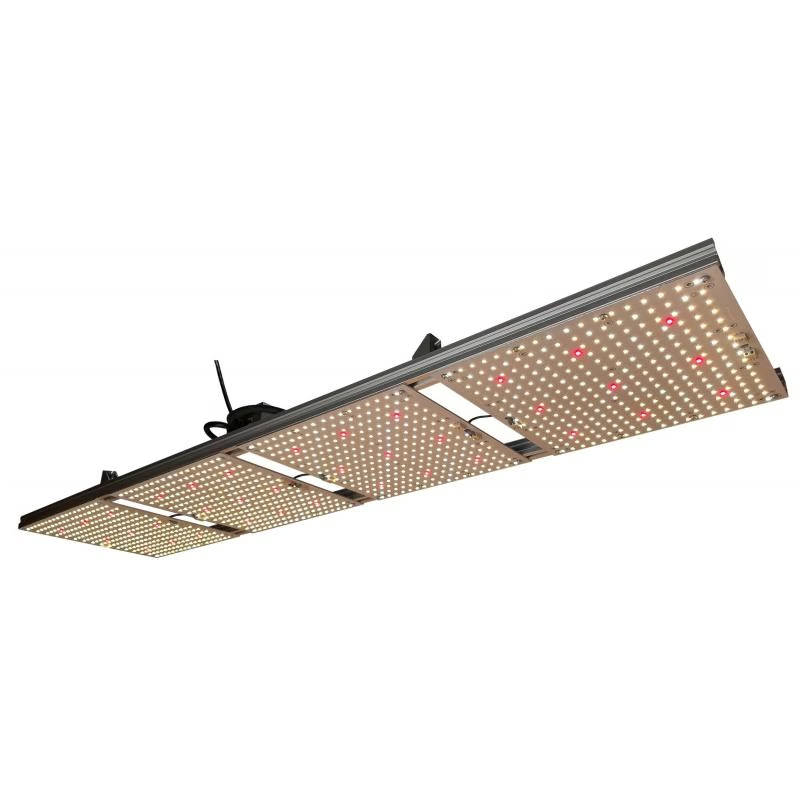
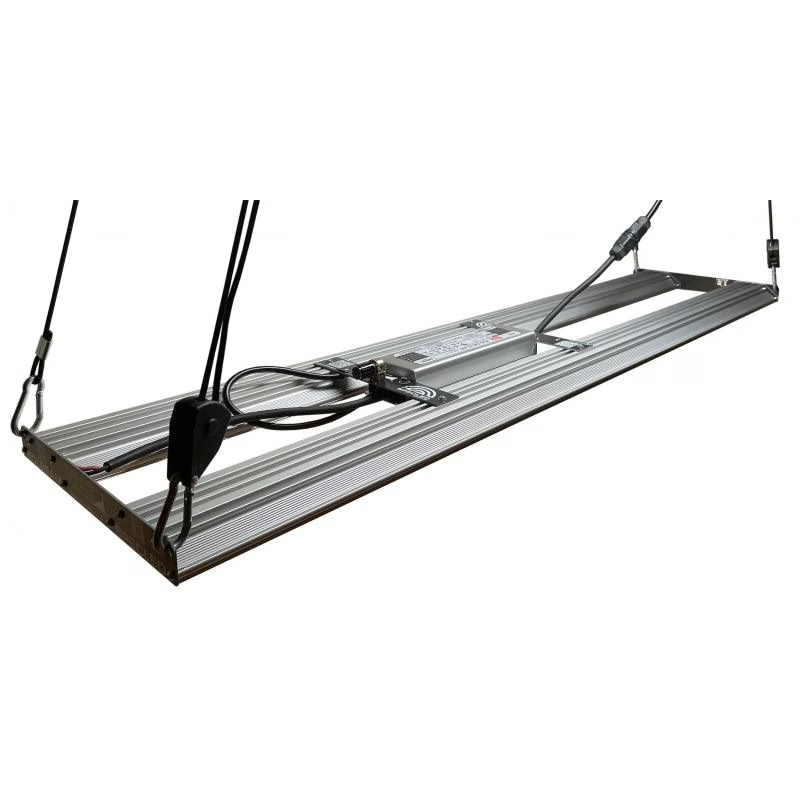
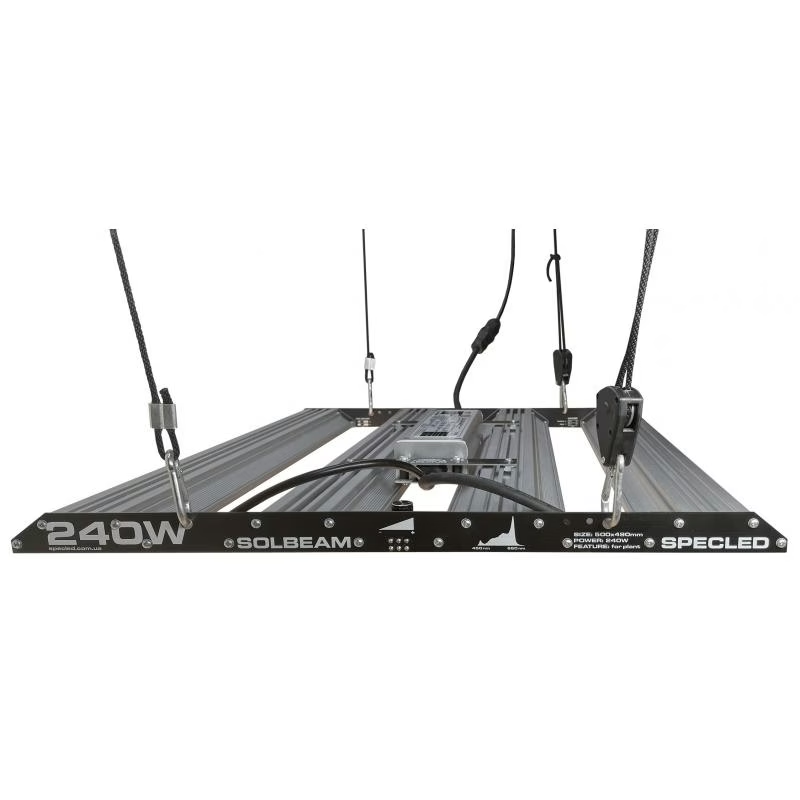
Look at the first two rows. A blue-red grow light has a DER fourteen times higher than a warm white LED: two lux on the meter already reaches the evening limit of 10 lx EDI. For spectra like these, lux is useless as a guide.
Lux fails plants for the same reason, which is why horticulture uses PPFD instead. We covered that in Lumens vs PPFD: what really matters for plants↗, with an interactive widget that shows the difference.
EML (WELL v1) is the legacy metric from the first version of the WELL standard. It is rigidly tied to EDI: EML = 1.103 × EDI. It is kept for anyone cross-checking older documents.
M/P ratio (WELL) is melanopic lumens over photopic lumens, which is DER multiplied by 1.103.
PPFD is the photon flux density between 400 and 700 nm at the eye. It shows how differently lux and photons relate across spectra: a white LED delivers about 14 µmol·m⁻²·s⁻¹ per 1000 lx, a blue-red grow light about 126.
Irradiance 380–780 nm is the total visible radiant power, in W/m².
The α-opic table
Five rows for five receptor types: three cone types, rods and melanopsin. CIE S 026 calls them S-cone-opic, M-cone-opic, L-cone-opic, rhodopic and melanopic.
- Irradiance, mW/m² — radiant power weighted by that receptor's sensitivity function.
- ELR, mW/lm — the same quantity divided by lux. Independent of level.
- DER — the ratio of ELR to the ELR of D65 daylight. The bar beside it shows the value relative to unity: the tick in the middle is D65.
- EDI, lx — equivalent daylight illuminance for that receptor.
- Age-corrected EDI — appears whenever the age differs from 32.
The melanopsin row is highlighted because that is the one driving circadian effects. The rest are useful for colorimetry and for judging how lopsided a spectrum is.
Melatonin models
Two independent predictions sit here, and they are deliberately different.
CS and CLA 2.0 come from the Lighting Research Center (LHRC) model and are not part of CIE S 026. CLA is circadian light weighted not by a single function but by a scheme that includes a blue-yellow opponent channel and rod inhibition. CS is the predicted fraction of melatonin suppression, with a model maximum of 0.7. The widget also shows whether the blue-yellow channel is active and how long it takes to accumulate the dose equivalent to CS = 0.43 (the UL DG 24480 benchmark).
Giménez et al. 2022 is a logistic model fitted to pooled laboratory data. Its only inputs are melanopic EDI, duration and pupil state.
Why the numbers differ: for a 4100 K LED at 100 lx over one hour, CS predicts 12% while Giménez predicts 34%. The models were fitted on different datasets, treat the spectrum differently and grow differently with time:
| Duration at 100 lx | CS | Giménez |
|---|---|---|
| 0.5 h | 0.064 | 29.5% |
| 1 h | 0.124 | 34.0% |
| 2 h | 0.221 | 44.3% |
| 3 h | 0.293 | 55.8% |
Treat them as two independent estimates of the same phenomenon. Agreement on the order of magnitude is already a good sign; identical percentages are not to be expected. Read anything below roughly 10% as «the effect is small» rather than as an exact figure.
Targets and reverse calculation
Four benchmark rows, each marked as met or not, with two conversions: how many lux you need at the eye and what PPFD that is for your spectrum.
- Daytime: at least 250 lx EDI — Brown et al. 2022, ANSI/IES RP-46-25, WELL v2 L03 tier 2.
- WELL v2 L03 tier 1: at least 136 lx EDI.
- Evening, 3 h before bed: at most 10 lx EDI.
- Bedroom at night: at most 1 lx EDI.
The reverse calculation assumes the standard observer. For anyone aged 65 and over, multiply the required illuminance by roughly 1.5.
The chart
Everything on the chart is normalised to its maximum so the shapes stay comparable:
- Source — a preset or your own spectrum loaded from a CSV file.
- Melanopsin-weighted — the filled area: the part of the spectrum that actually drives the circadian system. It makes visible why the red peak of a grow light contributes almost nothing to EDI.
- D65 at the same illuminance — the reference: if your curve sits lower in the blue, your DER is below one.
- V(λ) — the photopic curve that lux is built on.
- Curves for all five receptors and age-corrected melanopsin — toggled with the buttons under the chart.
The «Download CSV» button
Exports every result plus the spectrum itself on the 1 nm grid in machine-readable form: calculation parameters, summary quantities, the α-opic table and 401 rows of spectral irradiance. Numbers use a decimal point and no locale formatting.
Blue light before bed: how much is too much
«Blue light before bed is bad» is useless advice until someone puts a number on it. The evening threshold is 10 lx melanopic EDI. What that means on a lux meter depends entirely on the spectrum:
| Source | Melanopic DER | Evening limit of 10 lx EDI, on the meter |
|---|---|---|
| Blue-red grow light 450/660 nm | 5.67 | 1.8 lx |
| LED 6590 K | 0.855 | 11.7 lx |
| Phone or laptop screen | ≈ 0.66 | ≈ 15 lx |
| LED 4100 K | 0.632 | 15.8 lx |
| Incandescent 2856 K | 0.496 | 20.2 lx |
| LED 2730 K | 0.406 | 24.6 lx |
| Retro filament lamp 2200 K | 0.343 | 29 lx |
| Candle, 1800 K | 0.241 | 42 lx |
Three things follow from this table.
Warm light softens the problem, it does not solve it. Going from a cool white LED to a warm one buys you about a factor of two. Dimming buys you exactly the factor you dim by. The dimmer beats the colour temperature switch.
Night mode on a screen works the same way. It shifts the spectrum from cool white towards warm white, which is the same factor of two in DER. Screen brightness, on the other hand, you can change by a factor of tens, so brightness is what decides.
A blue-red grow light is a special case. Its DER is fourteen times higher than a warm white LED's. The evening limit arrives at 1.8 lx, which is the level of faint light leaking from under a grow tent door. A lux meter will mislead you badly here; use the calculator instead.
How to check your own room: measure the vertical illuminance at eye level in your evening setting, feed it into the calculator together with your lamp's spectrum and look at the scale. If the marker has left the evening zone, you have two options — turn the level down or change the spectrum.
Circadian lighting requirements: the four numbers
Circadian lighting means designing light for the body clock rather than for vision alone. What gets specified is not the illuminance on the desk but melanopic EDI at eye level in the vertical plane — the light that actually enters the eye given where you are looking.
| Benchmark | Value | Source |
|---|---|---|
| Daytime, working hours | at least 250 lx mel-EDI | Brown et al. 2022, ANSI/IES RP-46-25, WELL v2 L03 tier 2 |
| WELL minimum tier | at least 136 lx mel-EDI | WELL v2 L03 tier 1 |
| Evening, 3 h before bed | at most 10 lx mel-EDI | Brown et al. 2022 |
| Bedroom at night | at most 1 lx mel-EDI | Brown et al. 2022 |
Note the asymmetry: a lot during the day, very little in the evening, with a factor of 250 between the two. Ordinary domestic lighting of 100–200 lx falls short of the daytime target and simultaneously exceeds the evening one threefold. That is the core problem with household light.
For the visual side of the job — how many luminaires a room needs and what illuminance they produce — use our room lighting calculator based on EN 12464-1↗.
How light affects sleep
The chain is short. Light hits the retina, melanopsin in the ipRGCs responds and sends a signal to the suprachiasmatic nucleus of the hypothalamus, the body's master clock. From there the pineal gland gets its instruction: with enough light, melatonin production is suppressed; in darkness it rises. Melatonin is not a sleeping pill, it is the «night has started» signal that body temperature, blood pressure and sleep readiness follow.
How strong the effect is depends on four things.
Intensity. The response is logarithmic: the step from 1 to 10 lx matters more than the step from 300 to 400. That is why these calculations always deal in orders of magnitude rather than percentages.
Spectrum. The same radiant power in the blue acts several times more strongly than in the red. Hence the whole metrology: two sources equal in lux can differ several-fold in melanopic EDI.
Duration. Five minutes of bright light and two hours of the same light are different doses. Both models in the widget take duration as an input.
Time of day. The same light advances your rhythm in the morning and delays it late in the evening. The calculator gives the strength of the stimulus but not its sign: the direction of the phase shift depends on where you are relative to your own core body temperature minimum, which is outside its scope.
The practical conclusion that created this whole field of metrology: illuminance in lux does not describe what light does to sleep. You need a quantity weighted by the sensitivity of melanopsin.
Best light for sleep: what the numbers say
For the bedroom the threshold is 1 lx melanopic EDI. Here is how many lux you can afford at the eye with different nightlight colours:
| Nightlight | Melanopic DER | Limit of 1 lx EDI, on the meter |
|---|---|---|
| Red 660 nm | 0.0008 | 1,210 lx |
| Red 630 nm | 0.0022 | 464 lx |
| Amber 605 nm | 0.0080 | 126 lx |
| Yellow 590 nm | 0.0198 | 51 lx |
| Candle, 1800 K | 0.241 | 4.2 lx |
| Warm white LED 2730 K | 0.406 | 2.5 lx |
The gap between a red and a warm white nightlight is three orders of magnitude. At household brightness, amber and red barely touch the circadian system, which is exactly why they end up in nurseries and hallways. A warm white nightlight crosses the threshold at 2.5 lx, and that is a very dim glow indeed.
So, in figures, the best light for sleep comes down to three properties rather than a brand:
- Spectrum first. Amber around 590–605 nm is the sensible compromise: red 660 nm scores best on paper but renders detail so poorly that it is hard to navigate by.
- A dimmer second. Whatever the colour, the level is a straight multiplier. Warm white at 2 lx beats amber at 60 lx.
- Position third. A nightlight below eye level, aimed at the floor, delivers a fraction of the vertical illuminance that the same lamp produces facing you.
One caveat on the table above: it describes the melanopic system, not vision. Colour rendering under amber and red light is poor, so match the choice to what you actually need to see at night.
Entering your own data
The rest of this page documents the three input blocks: what you can load into each one, what the widget reports back about your data and how to measure the level correctly.
Step 1. Spectrum
The «Presets» tab
Sixteen sources from CIE 015:2018 plus the CIE reference illuminants. The list spells out the type and the correlated colour temperature. LED-B1…B5 are blue-pumped phosphor LEDs from 2730 to 6590 K. LED-BH1 is white with added red. LED-V1 and V2 are violet-pumped. HP1 is high-pressure sodium, HP4 is metal halide.
Presets serve two purposes: a quick order-of-magnitude estimate, and a reference to compare your own source against.
The «Your data» tab
It accepts a table of two or more columns: wavelength first, values after. Separators can be tab, semicolon, comma or space. Decimal commas are recognised, so an export from a European Excel pastes in as is.
What is detected automatically:
- Units from the header. If the header contains
µmol,µW/cm²,mW/m²orW/m², the unit is filled in for you and the report says «units detected from the header». - OceanView format. Everything before the
>>>>>Begin Spectral Data<<<<<marker is skipped and the unit is taken from the Processing line. - Micrometres. Wavelengths in the 0.38–0.78 range are multiplied by 1000.
- Several value columns. A «Value column» dropdown appears, labelled with the header names.
Units are set manually or confirmed:
| Choice | When to use it |
|---|---|
| Relative (energy) | A datasheet spectrum, a digitised graph, any uncalibrated curve |
| Relative (photons) | The same curve plotted in photon units, common for grow lights |
| W·m⁻²·nm⁻¹, mW·m⁻²·nm⁻¹, µW·cm⁻²·nm⁻¹ | A calibrated spectrometer, energy units |
| µmol·m⁻²·s⁻¹·nm⁻¹ | A calibrated spectrometer, photon units |
Photon units are converted to energy by multiplying by 119.6266/λ before resampling.
Once an absolute unit is selected, the «As measured» mode becomes available: the level comes straight from the data and you do not have to enter anything.
What the report tells you
| Message | What it means |
|---|---|
| 1 nm step, used as is | Your data landed on the working grid unchanged |
| Step finer than 1 nm, averaged into 1 nm bins | Spectrometer data is averaged over intervals rather than thinned out, so peaks survive |
| Uniform N nm step, Sprague interpolation | The CIE 167 method for uniformly spaced data |
| Irregular step, monotone PCHIP spline | Typical for digitised graphs: the spline adds no false oscillation between points |
| Negative values set to zero (X% of the sum) | Your data contained sub-zero noise. Up to 1–2% is normal for measurements; tens of percent mean the spectrum was taken at the limit of sensitivity |
| Data start at N nm | Anything shorter is treated as zero. The 380–450 nm stretch matters for S-cones and melanopsin |
| N nm step is too coarse | Narrow LED and discharge peaks get distorted at that step |
| Looks like raw spectrometer counts | The header contains the word counts. Without calibration this is not an emission spectrum: the shape is distorted by the instrument's response |
Errors appear as a separate red line: no wavelength–value pairs found, no data between 380 and 780 nm, spectrum is zero.
Where to get your lamp's spectrum
- A datasheet graph. Digitise the curve in our spectrum digitiser↗, save the result as CSV and upload the file here. That accuracy is sufficient: DER changes by a few percent for reasonable digitising errors.
- A spectrometer. Exports from OceanView, SpectraSuite or any instrument with a text output paste in as is. If the file is calibrated, pick an absolute unit and the «As measured» mode.
- The closest preset. For white LEDs, estimating from LED-B1…B5 at a matching colour temperature gives DER to within about ten percent. Never do this for blue-red grow lights: their DER is an order of magnitude higher and colour temperature tells you nothing.
Step 2. Level at the eye
«Lux» mode
What the calculator needs is the vertical illuminance at eye level, in the direction of gaze. This is not the illuminance on your desk: in rooms with ceiling lighting, vertical illuminance at the eye is typically two to three times lower than horizontal illuminance on the table, because much of the flux arrives from above and never enters the eye.
How to measure it: hold the sensor vertically at eye level, facing the way you are looking. Looking at a monitor means the sensor faces the monitor. Turn your head towards the window and the number changes — as it should, because the melanopic dose depends on gaze direction.
A phone lux meter is fine for an order-of-magnitude check but not for compliance work: the ambient light sensor is coarsely calibrated and strongly angle-dependent.
«PPFD» mode
Here you need the PPFD where the eyes are, not above the plants. The difference is substantial: 600 µmol·m⁻²·s⁻¹ over the canopy can be 30 at the operator's face in the aisle.
Keep in mind that a quantum sensor only counts photons between 400 and 700 nm. If your lamp has a lot of far red, PPFD does not see it — and neither do the eye and melanopsin, so this costs the calculation nothing.
We also built a spectrum-aware lux to PPFD calculator↗. Its conversion coefficients come from our own spectrometer measurements of dozens of different light sources.
«As measured» mode
Available for absolute units only. The widget takes the level straight from your spectrum and shows the illuminance and PPFD that follow from it. This is the most honest mode: a single spectroradiometer measurement gives you both the shape and the level.
Step 3. Observer and exposure
Age. The lens yellows over the years and lets through less blue. The widget applies the ocular media density model of van de Kraats and van Norren relative to age 32. For a 4100 K LED at 300 lx, melanopic EDI itself does not change — it is defined for the standard observer — but the amount reaching a particular retina does:
| Age | Share of the standard observer |
|---|---|
| 20 years | 108% |
| 32 years | 100% |
| 50 years | 84% |
| 65 years | 70% |
| 75 years | 61% |
| 90 years | 48% |
In practice: at 65 you need roughly one and a half times more light for the same circadian effect, at 90 about twice as much. Age-related pupil constriction is not in the model, so the real gap is wider still.
One important detail: the age correction applies to the α-opic quantities only — the line under the headline number and the last column of the table. CS, CLA and the Giménez prediction are always computed for the standard observer.
Exposure duration. It feeds the two models at the bottom. The LHRC model works over 0.5–3 hours and the widget flags anything outside that as extrapolated. The Giménez model was built on exposures of 30–240 minutes.
Light position. The spatial factor of the LHRC model: light filling the whole visual field acts more strongly than a desk lamp, and noticeably more strongly than ceiling luminaires overhead. It does not affect EDI, only CS.
Pupils. Pharmacologically dilated pupils admit more light and form a separate term in the Giménez equation. For normal conditions, leave «natural».
Typical scenarios
A desk during the day. The target is 250 lx EDI. With a white 4100 K LED that means 395 lx vertically at the eye, which usually reveals that the standard 300–500 lx on the desk is not enough: you need light near the screen or a seat closer to the window. For the outdoor reference, see how much light the sun actually delivers↗.
The bedroom. The target is 1 lx EDI. With the same LED that is 1.6 lx at the eye, which any indicator light or nightlight in your field of view easily exceeds.
Comparing two lamps. Enter both spectra in turn at the same illuminance and compare DER. If DER differs by a factor of two, the circadian effect differs by a factor of two at equal visual brightness.
FAQ
How much light before bed is acceptable?
If you only have a lux meter and know nothing about the spectrum, a safe household estimate is 15–20 lx at the eye during the three hours before bed. For the exact figure, enter your lamp's spectrum above and watch the evening zone of the scale.
How long does light take to act?
The models cover exposures from half an hour upwards. For a 4100 K LED at 100 lx at the eye, predicted melatonin suppression grows from 30% after half an hour to 56% after three hours. So the meaningful effect builds over tens of minutes, not seconds, and accumulates with time.
Does screen night mode help?
Partly. Spectrally it moves the screen from the cool white category to warm white, which is about a factor of two in DER. Lowering the brightness does more. The best result comes from combining both: warm mode plus the lowest comfortable brightness.
Does age matter?
Considerably. By 65, roughly 70% of the blue light reaches the retina compared with a 32-year-old observer, and by 75 about 61%. For the same circadian effect, an older person needs around one and a half times more daytime light. Set the age in the third block and the widget shows the correction on its own line.
Can I measure with my phone?
For an order of magnitude, yes. For any compliance conclusion, no: the ambient light sensor is coarsely calibrated and strongly angle-dependent. It also measures no spectrum at all, and the spectrum is exactly what sets DER.
What this calculator does not do
- It does not measure. No conclusion is better than the input data: a datasheet spectrum differs from the real lamp because of the production batch, driver current, temperature and phosphor degradation.
- It does not track your day. Both models describe a single exposure, not the dose accumulated over 24 hours, and not the timing relative to your own rhythm.
- It ignores flicker and the temporal structure of light.
- It is not a medical instrument. Individual light sensitivity varies by more than an order of magnitude, and a population-average prediction does not describe a particular person.
- EDI is a metrological quantity, not a diagnosis. It tells you how much light the circadian system receives, and nothing about how a given body will respond to it.
Conclusions
During the day, err on the side of too much. Every standard sets a lower bound: 250 lx melanopic EDI is a minimum, not an optimum. Your body compares light not against a standard but against the sky, and even an overcast day outdoors delivers thousands of lux against hundreds indoors. Falling short during the day is easy; overshooting is hard. The gain is non-linear, though: the step from 100 to 300 lx EDI is felt far more than the step from 1000 to 2000, and beyond that the return all but disappears. The limiting factor here is visual rather than biological: glare in the field of view and reflections on the screen tire you faster than the extra alertness helps. So add light with a window and with general lighting from above and the side, not with a brighter lamp straight in front of your eyes. And one honest caveat: daylight has a solid effect on alertness and sleepiness, while its effect on attention and memory is far less consistent across studies. This is not a productivity multiplier proportional to lux.
In the evening the spectrum takes over, and the result is less obvious than the folklore suggests. Check it in the calculator: an incandescent lamp at 2856 K has a melanopic DER of 0.496, while a warm white LED at 2730 K sits at 0.406. At equal lux the LED acts more weakly on melatonin than the «warm old-fashioned» classic, because the phosphor has a dip right around 480–500 nm where melanopsin peaks, while the incandescent spectrum is smooth and covers that region. The myth that «incandescent has almost no blue» does not survive the arithmetic: it delivers half the action of daylight per lux. What incandescent does have is a different, real advantage — on a dimmer it drifts down towards 2000 K and loses blue along with brightness, whereas an LED usually holds its colour temperature while dimming. Genuinely low values belong to candles (DER 0.241) and to amber and red sources (0.02 and below), where the 10 lx EDI evening threshold arrives at hundreds of lux on the meter rather than at a dozen and a half.
Light is not a background, it is a physiological signal, and over the past twenty years it has drifted out of alignment from both ends. By day we sit in rooms one to two orders of magnitude darker than outdoors, and the circadian system is starved of its main cue. By night the opposite: white LEDs are cheap and bright, there is more light around than ever, and a screen hangs thirty centimetres from the eyes pointing straight into them. The problem is not that LEDs are harmful in themselves — their spectrum simply turned out to be inconvenient for the evening. The good news is that both controls are in your hands, level and spectrum. The calculator on this page shows which of the two matters more in your case: for white lamps it is usually brightness, for blue-red grow lights it is the spectrum.
Sources
- CIE S 026:2018 — α-opic quantities and function tables (DOI 10.25039/CIE.DS.vqqhzp5a, CC BY-SA 4.0).
- CIE 015:2018 — reference illuminant spectra.
- CIE 167:2005 — Sprague interpolation.
- Rea, Nagare, Figueiro 2021 with the 2022 corrigendum — the CS and CLA 2.0 model.
- Giménez et al. 2022, J. Pineal Res. 72:e12786, equation 7 — melatonin suppression prediction.
- van de Kraats, van Norren 2007 — ocular media density by age.
- Brown et al. 2022, PLoS Biol. 20:e3001571 — the 250 / 10 / 1 lx recommendations.
- WELL v2 L03, ANSI/IES RP-46-25 — normative levels.
Everything is calculated in your browser; no data leaves the page.