Add the first channel and load a diode spectrum to start simulation.
Overall Metrics
Power Consumption0.00 W
Luminous Flux0 lm
Radiometric Power0.0 mW
Total PPF (400-700nm)0.0 µmol/s
ePAR (400-750nm)0.0 µmol/s
Efficacy (PPE)0.00 µmol/J
Luminous Efficacy0.0 lm/W
Luminous Efficacy (LER)0.0 lm/W
CCT
- K
CRI (Ra)
-
CQS
-
Circadian Metrics
CIE S 026
m-DERDaylight Equivalent Ratio
-
Melanopic EDIat 500 lx (standard / office)
- lx
Melanopic EDIat 250 lx (eye level)
- lx
WELL v2 / Effect:
-
ePAR Breakdown
UV (380-400)0%
Blue (400-500)0%
Green (500-600)0%
Red (600-700)0%
Far Red (700-750)0%
650-680nm Range Assessment:0%
Maximum for 660nm±5 peak:0
Chromaticity Diagram
CIE 1931 • Planckian Locus
x, y
- , -
Duv
-
Deviation
-
No data to display
Planckian Locus
Current Spectrum
Δuv (Duv)
CRI (R1-R14) Scores
During the development of LED lamps, especially in situations where it is required to reproduce a non-standard spectrum or obtain special parameters of emitted light, it is necessary to conduct an engineering evaluation, select the type of LEDs and their power consumption to obtain the required spectrum and/or luminous flux parameters.
To simplify the task, I created a special online tool with a simple and clear menu.
LED spectrum simulator is a tool that allows you to obtain the resulting spectrum by combining several LEDs with different color temperatures or wavelengths. It is also suitable for obtaining the final spectrum for mixed light sources.
LED spectrum simulator allows you to add digitized spectra of various LEDs (and other light sources) of different power ratings and from different manufacturers, specify LED parameters, and as a result see not only the final spectrum, but also parameters such as the final correlated color temperature (CCT), evaluation of CRI and CQS color rendering indexes, circadian metrics, as well as a large number of metrics used in creating special spectra for plant lighting.
Calculation of parameters for creating grow lamps:
ePAR distribution;
total PPE of the LED module being created;
total efficiency in PPF;
radiometric power;
total luminous flux;
deviation from the Planckian locus (Duv).
You can read more about the PPF parameter↗ in a separate article, and also read about the PPE parameter↗. Both articles contain an interactive widget for a clear explanation.
Our tool also allows you to compare the resulting spectrum with the blackbody spectrum, the solar spectrum, and the McCree curve.
One of the key features of the tool is the implemented ability to switch the spectrum display mode: radiant and quantum spectrum. This is very important when designing LED lamps for plants.
How to calculate the resulting luminaire spectrum using our simulator
Step 1:
To obtain the digitized spectrum of the LEDs selected for use in your project, use the LED spectrum digitizer tool↗. The tool is very easy to use and only requires a screenshot of the spectrogram from the LED datasheet. More detailed instructions for use can be found in the article on the page with the spectrum digitization tool. Save the digitized spectrum on your computer in .csv or .json format.
The spectrum simulation tool has a built-in parser, which allows you to directly enter the main parameters of this LED according to the datasheet into the name of the file containing the digitized LED spectrum parameters. Below is an example based on a Bridgelux Thrive series 5000K LED, a digitized spectrum in json format with the specified LED parameters: Thrive_5000K_9.1V_100mA_108Lm.json .
The parser is configured for parameters such as V, mA, Lm, PPF, or mW. The order of the values does not matter; the underscore character "_" must be used as a separator.
Let's break down the file name Thrive_5000K_9.1V_100mA_108Lm.json:
Thrive_5000K - an arbitrary name, convenient for indicating the LED type and its color temperature or wavelength;
_9.1V - forward voltage drop of a single LED (for Thrive LEDs this is 9.1 volts);
_100mA - rated forward current of the LED according to the datasheet;
_108Lm - luminous flux of the LED according to the datasheet at the rated current (100mA). You can also specify the radiant power in mW or the number of emitted photons in PPF. The script will automatically recalculate any of the specified parameters.
The recommended format allows you to enter all the LED parameters required for the calculation into the name of the digitized spectrum file, eliminating the need to check the LED datasheet each time to verify data, and the parser will automatically fill in the required fields immediately after loading the file into the spectrum simulation tool, which ultimately greatly simplifies modeling and saves a lot of time.
Step 2:
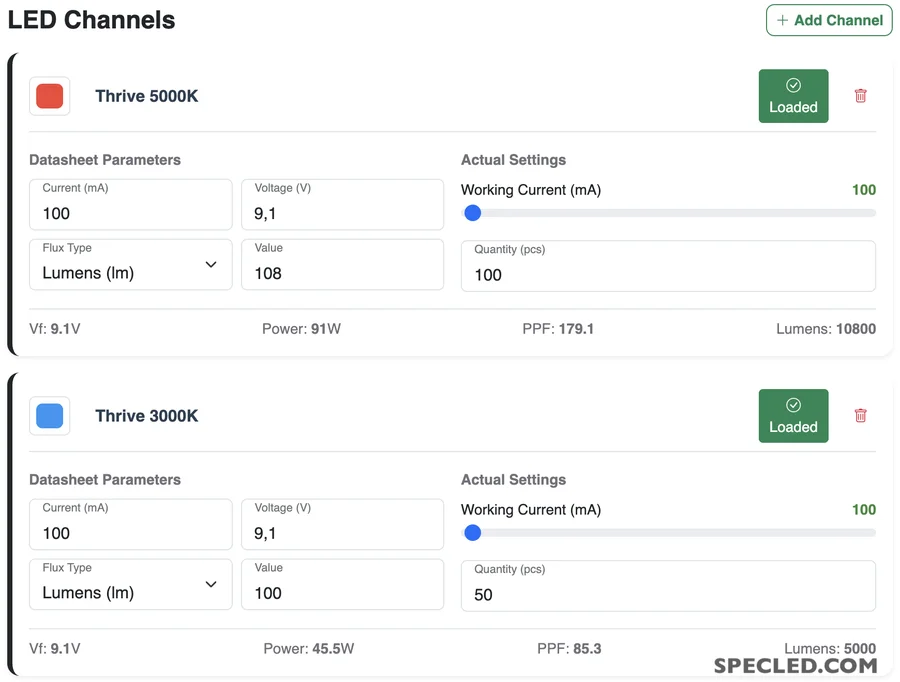
In the first channel window, use the "Upload spectrum (.json, .csv)" button to upload the file with spectrum parameters in .json or .csv format.
To add an additional channel, click the "+ Add channel" button. The maximum possible number of channels is 15.
Set the actual operating current for each of the added LED types, that is, the current that will actually flow through each LED in the operational module.
Specify the number of LEDs of each type intended to be installed in the LED module.
In case of an automatic parser failure, you can manually enter or correct all necessary LED parameters if needed.
For convenience, each channel additionally displays the resulting electrical power of the LED group, total PPF, and total luminous flux in lumens.
Step 3:
Set the necessary presets for displaying or comparing the resulting spectrum:
The menu is located right below the spectrum chart; this is where the checkbox for switching between the radiant and quantum spectrum displays is located.
The advanced settings menu also allows you to:
fill the spectrogram with color;
hide original spectra (indicated by dashed lines);
enable display of the McCree curve;
enable display of the solar spectrum;
enable display of the blackbody spectrum. Display is available only in radiant spectrum mode.
Step 4:
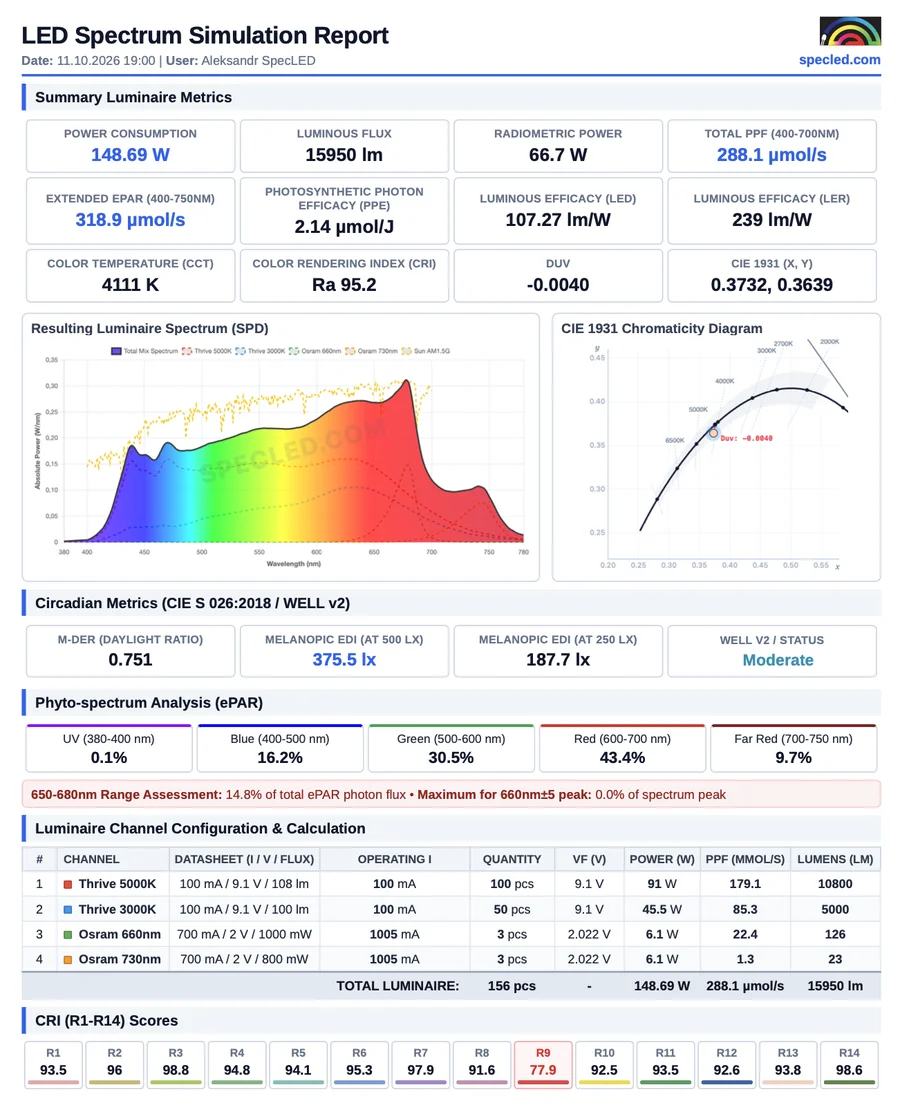
After loading the spectra and setting other input data, the tool automatically calculates the resulting spectrum, basic electrical parameters, and lighting parameters:
Total power consumption of all LED groups;
Total luminous flux in lumens;
Color temperature in Kelvins;
Color rendering data on the CRI and CQS scales;
Basic circadian metrics;
Total radiometric power of the luminous flux;
PPF for the PAR range;
PPF for the ePAR range;
Total light source efficiency in µmol/J;
Luminous efficacy in lm/W;
Luminous efficacy in LER. LER (Luminous Efficacy of Radiation) is a characteristic that shows how efficiently the human eye perceives the emitted stream of light. It is measured in lumens per watt and defines the ratio of total luminous flux to total radiant flux;
Chromaticity diagram and deviation from the locus (Duv).
During data analysis, you can change the current flowing through particular groups of LEDs (change power), add or remove LED channels, and the tool will dynamically recalculate the resulting spectrum.
After obtaining the desired result, you can download a PDF report that will contain all the parameters listed above, as well as the spectrogram in the form you configure using the additional checkbox menu. The PDF report is created in the language selected in the page settings.
If you need to obtain a color rendering evaluation and a graph according to the TM-30 standard, you can save the spectrum obtained as a result of the simulation in .csv or .json format, then return to the LED spectrum digitizer tool↗, load the saved file, and get a colorimetry report according to CRI, CQS, and TM-30 standards. Sample report in PDF format:
The main purpose of the LED spectrum mixing simulator
Having many years of experience in designing various LED modules for plants, I learned to calculate the spectrum based on the power ratio of the LEDs I chose to create a new module. Now I can accurately reproduce a given spectrum having only datasheets for the LEDs. But it was not always like this, and when I was learning, I went through a long path of mistakes; I failed to recreate the exact spectrum intended. I modeled, experimented, and brought projects to the target parameters. All these experiments took quite a lot of time.
With the emergence of a large number of full-spectrum LEDs (like the sun) or special-spectrum LEDs, the need arose to compare the spectra of LEDs from different manufacturers to choose the best option. This led me to the idea of creating a tool for digitizing the spectrum of LEDs or other light sources.
When the tool for digitizing the spectrum was ready, I realized that the main part of the code was already finished and creating a tool for simulating and calculating the final spectrum when mixing different LEDs was quite an achievable task. Such a simulator makes it possible to experiment with mixing spectra and see the final spectrum clearly in literally 1 minute, which makes my development unique and virtually the only one on the internet.
Mixing different spectra inevitably leads to a change in the overall color temperature, a change in the Duv parameter, and changes in the color rendering index. Parameters of this kind are not very important from the perspective of plant lighting, but are of paramount importance when designing domestic, industrial, or decorative lighting.
The created spectrum simulation tool allows solving all the above-mentioned tasks at once and is suitable for designing such lighting systems:
high-quality lighting for domestic use;
industrial lighting;
lighting of retail spaces and shop windows;
specialized lighting for film and photo shooting;
plant lighting systems;
experimental plant lighting systems with controllable channels;
interior lighting;
various types of controllable lighting for different purposes, from decorative to laboratory.
Features of the tool for simulating the spectrum of LED light sources
In addition to the main popular lighting parameters, our tool calculates circadian metrics, and the tool also performs a basic analysis of the spectrum in terms of plant lighting efficiency.
The calculation of additional parameters makes our tool maximally versatile and useful for use in designing light sources of completely different purposes.
A simple and clear menu allows even beginners to configure and use the LED spectrum simulator.
You can leave your public review, write a suggestion for improving the tool, or ask a question in a special field at the bottom of the page.
Evaluation of spectrum for plant lighting using the spectrum mixer
In addition to simulating the final spectrum obtained by mixing LEDs with different wavelengths and/or color temperatures from one or different manufacturers, our tool calculates all the main metrics used to evaluate plant lighting.
Quantum spectrum - a checkbox that switches the display between the standard radiant spectrum and the quantum spectrum! This is the most important parameter when evaluating a spectrum for plant lighting. For photosynthesis (a photochemical reaction), it practically does not matter what energy a photon of light has; the total quantity of photons received is of paramount importance.
The setting allows you to clearly see the difference between the two types of spectra. When analyzing a spectrum for plant lighting, be sure to activate the "Quantum spectrum" checkbox! The visual difference may surprise you.
To calculate the daily norm of photons received by a plant, the DLI parameter is used. For calculation, use our DLI calculator↗, which allows you to specify the light flux in PPFD and the number of hours during which the plant is illuminated.
Evaluation of the 650-680nm range is convenient for evaluating the spectra of white LEDs. How much light a white LED emits in the most efficient photosynthesis range. Some full-spectrum white LEDs with a high color rendering index have quite a large share of radiation in the far-red range of the spectrum. The metric also shows the maximum peak in the narrower 660nm ± 5nm range;
Evaluation of ePAR distribution shows how all the energy of the luminous flux is distributed across the spectrum ranges in percentages. It allows you to easily understand for which specific stages of plant development the spectrum is suitable;
Calculation of total PPF value for PAR and separately for the extended ePAR range;
Total PPE efficiency in µmol/J - the tool calculates this parameter taking into account the correction for the LED die temperature! This metric allows calculating with high accuracy the REAL efficiency of a designed LED module or an existing lamp, if the type of installed LEDs is accurately known.
When calculating, it is very important to consider the thermal correction, since when the LED die heats up, efficiency drops noticeably, and LED efficiency also decreases with increasing current above the rated value. Our tool also takes this decrease into account based on average values, just as it accounts for the increase in efficiency when reducing the current below the rated value.
It is taking into account such nuances that excludes the possibility of accurately calculating the total PPE of a luminaire by simply adding the PPE of all LEDs in the module. Marketers usually do this, misleading buyers.
Now, using our spectrum simulator, you can check the real parameters of your lamp if you are sure that the type of installed LEDs exactly corresponds to what was declared. There are often problems with this as well.
Circadian metrics
Circadian rhythm biomarkers are indicators by which scientists and doctors evaluate the functioning of the body's internal "biological clock".
The main parameters related to the evaluation of circadian rhythms that our tool calculates for evaluating spectrum mixing:
m-DER coefficient;
Melanopic EDI;
Well V2.
Read more about the effect of lighting on sleep and the melanopic EDI calculator↗ in the "knowledge base" section. Today, the study of the effect of lighting on humans, their activity, and health is actively developing and becoming increasingly relevant due to the development of LED lighting.
I have been working in grow light engineering since 2011, specializing in everything from custom aluminum-core PCB design to full-spectrum LED cultivation systems. Over the years, I have progressed f…