Anyone who grows plants at home or in a greenhouse occasionally asks the same question: how much light does the sun actually provide, especially across different seasons? Not just "bright" or "shady," but an exact number. On a summer noon, a windowsill seems flooded with light. On a winter noon, it may still feel bright—after all, the human eye adapts. But plants see a completely different picture, and the difference between a June and December noon can be sixfold.
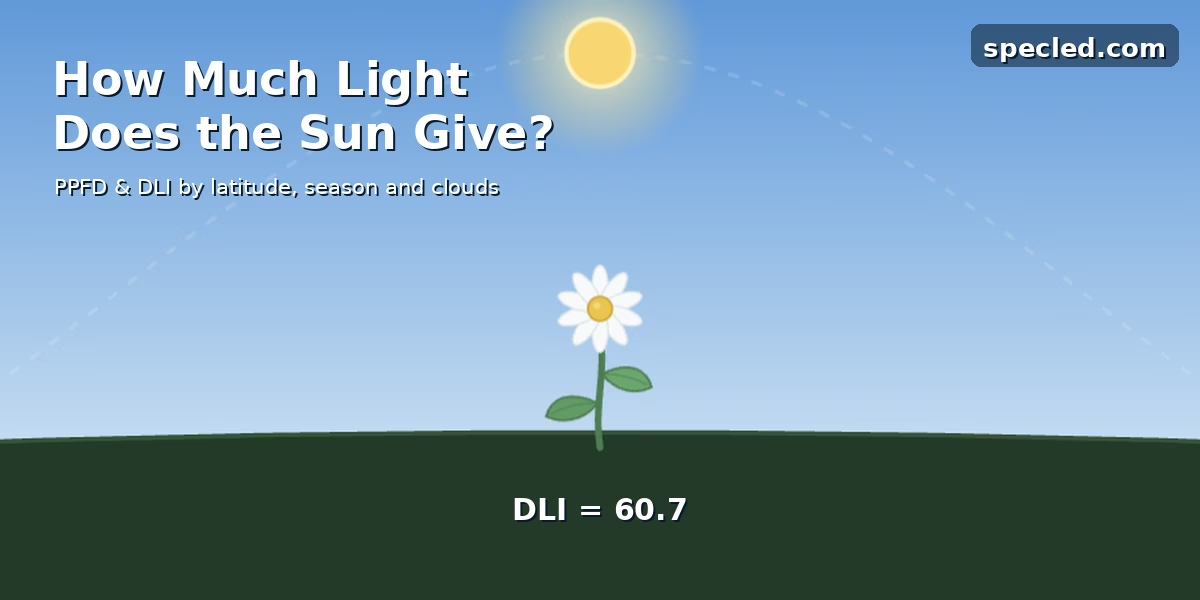
This widget clearly illustrates that difference. You can drag the time slider—the sun moves across the sky exactly as it does at your latitude on the selected day of the year, while the metrics update in real time: instantaneous PPFD, sun elevation angle above the horizon, day length, and the accumulated Daily Light Integral (DLI). Switch the season from summer to winter, and you will see why a windowsill ceases to be a viable spot for seedlings in December. Highly relevant every spring.
A Bit of Theory: Why Winter Sun is Weaker
The first thing that comes to mind is simply the shorter days. That is only half the truth. Even if a winter day lasted as long as a summer one, there would still be noticeably less light due to two independent physical effects.
Additionally, we offer a calculator for determining solar panel power generation, tilt angle, and orientation↗. The calculator also simulates the sun's path across the sky during different seasons and factors in the number of sunny days in your region.
Effect One: Angle of Incidence
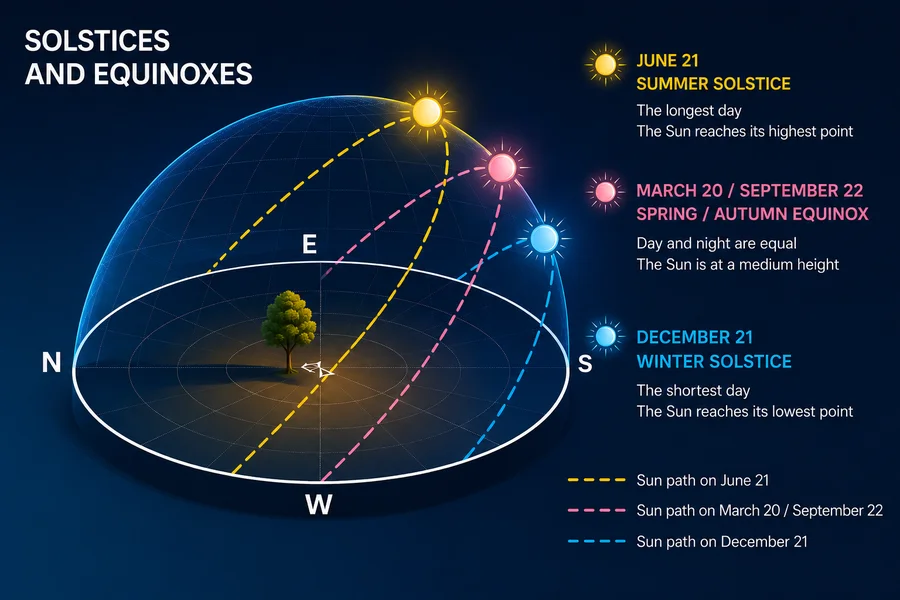
In mid-latitudes during summer, the noon sun rises 60–63° above the horizon. In winter, it reaches only 13–16°. A beam of sunlight hitting at a steep angle illuminates a small footprint, whereas a shallow angle spreads the same energy over a much larger surface. Horizontal surface illuminance drops proportionally to the sine of the solar elevation angle. Because of this alone, a winter noon loses about 70% of its intensity compared to summer.
Effect Two: Atmospheric Thickness
The second effect is less obvious but equally critical. When the sun is high, its rays travel through the atmosphere via the shortest possible path—an optical metric known as air mass, which equals 1.0 at the zenith. When the sun hangs low above the horizon, that same beam traverses the atmosphere at a sharp angle, extending the path length significantly: at 30° elevation, it is roughly two air masses; at 15°, nearly four; and near the horizon, up to forty.
Along the way, light is scattered by air molecules and airborne particles, and absorbed by water vapor and ozone. The longer the path, the greater the losses. This is precisely why the setting sun doesn't blind you and appears red—shorter wavelengths scatter much more heavily away from the direct path. For a plant, this means winter sunlight loses not only photon quantity but also undergoes a shift in spectral distribution.
Combined, these two effects create that sixfold drop: in Dublin or Kyiv, a clear summer noon delivers about 1,800 µmol/m²·s, compared to roughly 300 in winter.
What are PPFD and DLI in Plain English
PPFD (Photosynthetic Photon Flux Density) is the density of photosynthetic photons—meaning how many light quanta suitable for photosynthesis hit a square meter per second. Measured in µmol/m²·s, it represents an instantaneous value—a snapshot in time. At solar noon, PPFD peaks; at dawn and dusk, it drops near zero. We have an intuitive widget demonstrating photon flight and surface distribution in our guide on Photosynthetic Photon Flux Density↗.
DLI (Daily Light Integral) is the total daily light dose—how much light a plant receives over an entire 24-hour period. Measured in mol/m²·day, it is the time integral of PPFD: if PPFD is a snapshot, DLI is the cumulative daily exposure.
In practice, DLI matters far more. Roughly speaking, a plant doesn't care whether it gets its daily quota over six hours of intense sun or twelve hours of moderate light—the total sum is what counts (though you can't force-feed a plant its target DLI in a single hour without supplemental CO2, but that's a topic for another article). This is why a summer day with a DLI of 50–60 mol/m²·day allows plants to thrive at full capacity, while a winter DLI of 4–6 leaves them barely surviving. A detailed guide on calculating DLI and target values for different crops can be found in our dedicated article: DLI in Plant Cultivation↗.
Step-by-Step Guide: How to Use the Widget
Step 1. Select Your Latitude
The primary factor shaping the entire baseline is your geographic location. Not just your city or country, but your exact latitude: solar trajectories remain identical across any given parallel. Drag the latitude slider or select a preset—Dublin, Kyiv, Berlin, Madrid, Oslo, or the Equator.
Notice how the visual arc changes as you adjust the slider: the further north you go, the lower the winter solar arc and the shorter the day. At Oslo's latitude (60°), a winter day lasts just five and a half hours, with the sun barely climbing to seven degrees. The widget works for the Southern Hemisphere too—simply set a negative latitude, and seasons invert automatically.
Step 2. Set the Season
Use the day-of-year slider or the four season presets: Spring, Summer, Autumn, Winter. These buttons correspond to dates near the equinoxes and solstices: March 21, June 21, September 23, and December 21. These serve as the extreme and median benchmarks of the annual cycle.
The clearest comparison comes from toggling between summer and winter without touching other settings. The dashed arc on the stage maps the sun's daily path: in summer, it is high and wide; in winter, it hugs the horizon and shortens on both ends.
Step 3. Choose Sky Conditions
Three options: Clear, Partly Cloudy, and Overcast. This isn't merely decorative—cloud cover radically alters the outcome and impacts two components of sunlight differently.
Sunlight reaches the surface through two channels: direct beams from the solar disc and diffuse light scattered across the sky dome. Under clear skies, the direct beam dominates. Clouds attenuate direct radiation almost completely while simultaneously boosting diffuse light—making the sky glow uniformly. On average, an overcast day reduces light by 60% in summer and up to 40% in winter. That is why a cloudy winter windowsill drops to 150–200 µmol/m²·s—a threshold where most crops stall in growth.
Step 4. Scrub the Time of Day
The main slider runs from midnight to midnight. The sun moves along its arc, the sky shifts colors from midnight darkness through dawn hues to daytime blue, stars fade, and the plant below dims and brightens alongside the lighting. A clock in the corner displays the current time.
Watch the PPFD number: it rises from zero at sunrise, peaks exactly at solar noon, and drops symmetrically toward sunset. Notice how narrow the productive "light window" becomes during winter—meaningful PPFD levels persist for just three to four hours around noon.
Step 5. Analyze the Metrics
The widget outputs four key metrics. Current PPFD — instantaneous light intensity at the chosen moment. Solar Elevation — the angle above the horizon in degrees, which dictates both incidence angle and atmospheric attenuation. Day Length — hours the sun spends above the horizon on that date at that latitude. Daily DLI — cumulative daily light dose, calculated by integrating PPFD across all daylight hours.
Below is a diagnostic assessment for your selected crop type. The toggle offers three categories: Leafy Greens (lettuce, herbs, seedlings—requiring 10–17 mol/m²·day), Fruiting Crops (tomatoes, cucumbers, peppers—requiring 20–30), and High-Light Crops, especially medicinal tomatoes (requiring 30–45). The widget compares calculated DLI against the required threshold and gives a straight answer: Deficient, Sufficient, or Surplus.
How to Apply This in Practice
The core practical value of this widget is visualizing the physics on a simple graphic and obtaining realistic, regionally accurate baseline figures. Input your latitude, select December, set the sky to overcast, and check the DLI. If it reads 2–3 mol/m²·day and your crop requires 20, the question of whether you need supplemental lighting is settled—with an exact target: you are short by roughly 17 moles per day.
You can easily convert this deficit into a technical requirement. Knowing your DLI shortfall and target photoperiod, calculate the required artificial PPFD: divide the missing DLI by the lighting runtime in seconds. For example, supplying 17 mol over a 16-hour photoperiod requires approximately 295 µmol/m²·s of supplemental light at canopy level.
A second application is greenhouse planning or crop placement. Comparing summer and winter figures reveals which months a greenhouse can rely purely on solar radiation and when yield will drop without supplemental grow lights. For northern latitudes, this dark period lasts much longer than often assumed: by October, DLI already drops below the threshold for fruiting crops.
Light for Seedlings
The widget answers the question of why an LED grow light is necessary for seedlings in winter. Specifically, the low PPFD levels during winter and early spring, combined with short daylight hours, prevent the plant from reaching its target daily light integral (DLI), even on a south-facing windowsill.
Using this widget, you can clearly visualize all the data, select your region and weather conditions, and accurately calculate exactly how much supplemental light your seedlings or other plants are lacking.
How Accurate is the Model
The widget computes solar trajectories via astronomical algorithms combined with a standard atmospheric attenuation model. Solar declination, hour angle, solar elevation, Kasten–Young air mass calculations, and separate modeling of direct versus diffuse radiation—these are established optical engineering frameworks rather than arbitrary approximations.
However, we must state the limitations clearly. The calculation assumes a clean atmosphere at an elevation of 100 meters above sea level. It does not account for urban smog, industrial pollution, localized microclimates, terrain blockage, building shadows, or snow albedo (which can add a noticeable reflective boost in winter). Real-world readings at your specific location will vary—typically trending lower in cities and higher in alpine regions.
The model answers the question: "How much light does the sun provide under ideal conditions at this latitude on this date?" It serves as an excellent planning baseline, but not a replacement for on-site PAR meter measurements. If you need absolute precision for your specific windowsill or greenhouse, measure it directly. The widget shows the upper physical limit of what you can expect.
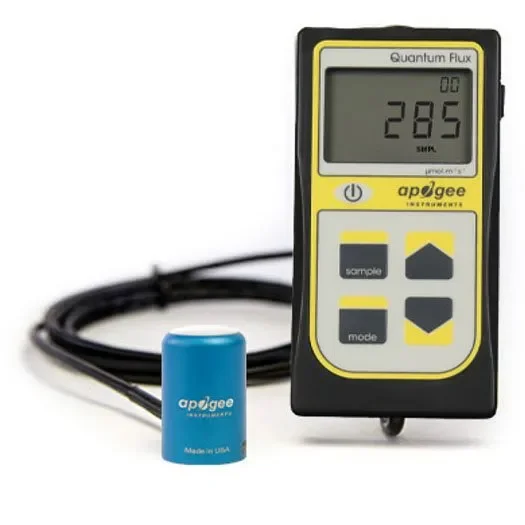
Of course, I understand that a quantum meter is not a $10 tool like a simple lux meter and not everyone owns one, which is why I previously built a highly accurate Lux to PPFD Calculator↗. It features presets and allows you to manually input custom grow light spectra. If you need to convert natural sunlight lux readings to PPFD, select the "Full Spectrum" model and add approximately 10% to the output PPFD.
Summary
Winter sunlight is weaker than summer light not just because days are shorter. Low solar angles and extended atmospheric path lengths combine to drop noon light intensity by five to six times, even on clear days. Add cloud cover, and the deficit widens to tenfold.
For plant growth, the cumulative daily dose (DLI) matters far more than instantaneous brightness. In summer, nature provides 50–60 mol/m²·day; in winter at mid-latitudes, it drops to 4–6. The gap between these figures represents the exact workload your supplemental grow lights must deliver. The widget above lets you see this difference clearly—translating the subjective feeling of "it's a bit dim in winter" into an actionable agronomic number.