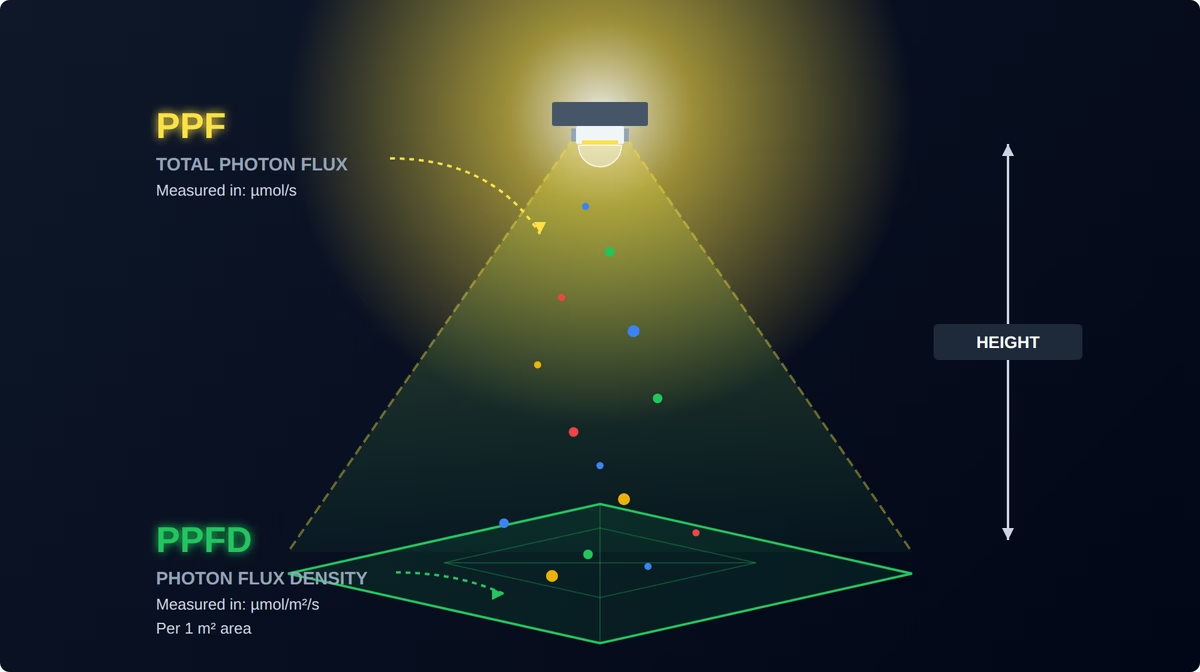
PPF (Photosynthetic Photon Flux) is the total amount of photosynthetically active light a fixture emits per second in all directions. It is measured in μmol/s.
PPFD (Photosynthetic Photon Flux Density) is the density of that photon flux — how much of this light actually lands on a given surface, usually at the level of the plant's leaves. It is measured in μmol/m²/s.
In short:
PPF is how much light the lamp produces.
PPFD is how much light the plant actually receives.
Why PPF and PPFD Are Different Things
PPF is a datasheet figure for the fixture. It is fixed and does not depend on where or how the lamp is installed. The correct way to obtain the PPF of a light source is to place the lamp in an integrating sphere. The wrong way is to calculate it from the LED datasheets: that result is simply incorrect and always overstated.
PPFD depends on geometry: mounting height, beam angle, secondary optics and distance to the plant, as well as on how reflective the grow tent walls are. The same fixture with a fixed PPF will deliver 800 μmol/m²/s at a 30 cm hanging height and only 300 μmol/m²/s at 80 cm. The method here is a physical measurement at the required distance, taken with a quantum sensor (PAR meter) or a calibrated spectrometer.
| Parameter | PPF | PPFD |
|---|---|---|
| What it measures | Total output of the lamp | Light density on a surface |
| Unit | μmol/s | μmol/m²/s |
| Depends on mounting height? | No | Yes |
| Where it is measured | In a lab (integrating sphere) | At canopy level |
| What it is used for | Comparing fixture efficiency | Setting hanging height and lighting layout |
When choosing an LED grow light for plants ↗, we recommend looking at the PPFD map first — it shows how light is spread across the area, not just the brightest spot under the centre of the lamp. The metric is genuinely useful, although if the LED fixture is roughly the size of the tent itself, uniformity is practically guaranteed.
How do you find PPFD if all you have is a lux meter? You cannot get PPFD directly from its readings: the result depends on the spectrum of the particular lamp. And that point matters a great deal. How this conversion works, and why no single universal coefficient exists, is covered in a separate article — lux to PPFD calculator that accounts for lamp spectrum ↗.
The McCree Curve: Why Not All Photons Are Equally Useful
In 1972 Keith McCree measured how effectively light of different wavelengths drives photosynthesis and plotted a relative quantum efficiency curve. It has two peaks — blue at around 440 nm and red at around 660 nm — with a noticeable dip in the green region.
This adds an important caveat to the very concept of PAR. The PAR range treats every photon between 400 and 700 nm as equally useful, but the McCree curve shows that this is a simplification: a green photon contributes roughly a quarter less to photosynthesis than a red one. The practical conclusion is not obvious but it matters — two lamps with identical PPFD can produce different results if their spectra differ.
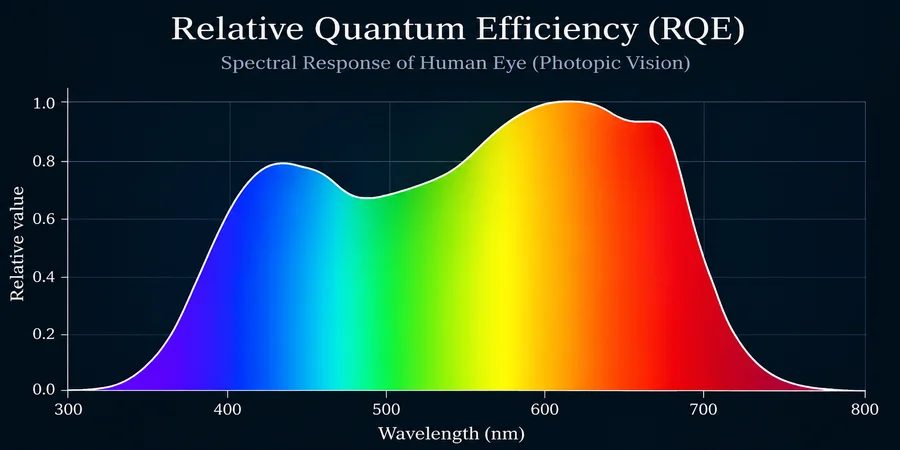
That said, the McCree curve should not be treated as gospel. It was obtained on single leaves under laboratory conditions, and within a dense canopy green light performs better than the curve predicts: it penetrates deeper through the upper leaf layers and reaches the lower ones, whereas red and blue are absorbed almost immediately. So the curve is a useful reference for judging a spectrum, not an exact yield formula. On top of that, there is currently a great deal of debate around ePAR versus PAR — whether 380 nm and 730 nm should be counted within PAR at all. It is a difficult question.
You can compare the spectrum of a specific setup with the McCree curve in our growlight spectrum simulator ↗.
How Much PPFD a Plant Needs (Average for Light-Hungry Species)
| Growth stage | PPFD (μmol/m²/s) |
|---|---|
| Seedlings and clones | 100–300 |
| Vegetative growth | 400–600 |
| Flowering and fruiting | 600–900 |
| Peak demand (tomatoes, medical crops) | 800–1200+ (with CO₂ supplementation) |
How Much PPFD the Sun Gives
To stop the numbers in the table above from being an abstraction, it helps to compare them with natural light. The PPFD of the sun varies enormously with season and cloud cover.
| Conditions | Sun PPFD (μmol/m²/s) |
|---|---|
| Clear summer noon | around 2000 |
| Clear winter day, mid latitudes | 300–600 |
| Overcast weather | 200–400 |
| Indoors near a window | usually below 100 |
Our own measurement of the solar light spectrum: what the real spectrum of sunlight looks like on a clear day, and how it differs from the spectrum of an LED grow light.
How PPFD and DLI vary with latitude, season, and cloud cover is covered in detail, with a visual simulator, in a separate article: How Much Light Does the Sun Give ↗.
The table and our measurements show that 600–900 μmol/m²/s inside a grow tent is not "low" — it is roughly a third to a half of the summer solar peak. The difference is that the sun holds its 2000 for only two or three hours a day, and only in clear weather, while a fixture delivers its figure steadily for 14–16 hours straight. So the total daily light integral inside a tent is entirely comparable to open ground, and sometimes exceeds it.
How PPFD Is Measured in Practice
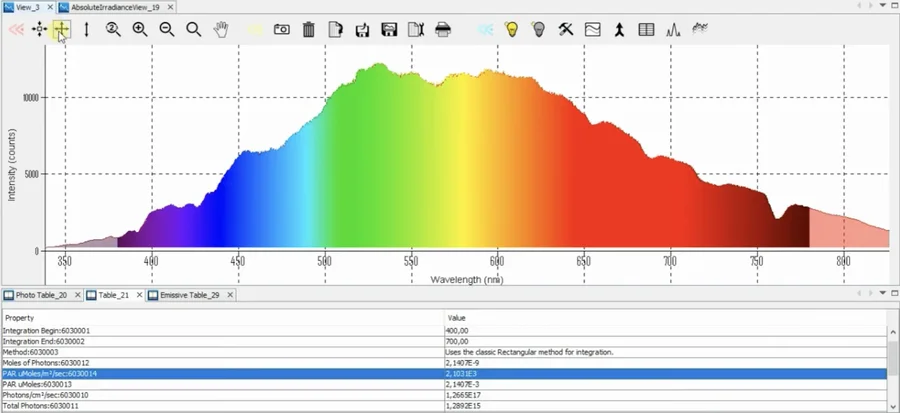
PPFD is measured with a quantum sensor or a spectrometer at canopy level, or on the floor of the grow tent, or across the plane of a test bench. The same instrument is what you use to measure LED spectrum as well: a calibrated LED light spectrometer reports both the spectral distribution and the absolute photon flux at once.
To build a light map (PPFD map), readings are taken on a grid: the area is divided into equal cells, a value is recorded in each one, and then the average and the uniformity coefficient — the ratio of the minimum value to the average — are calculated. How this procedure works on equipment calibrated against a NIST-traceable reference is described in our article on how we measure the spectrum and light output of grow lights ↗. A more detailed piece on how we build our 3D light maps is coming later.
The Bottom Line
PPF tells you how much light a grow light or an LED produces. PPFD tells you how much light the plant actually receives. For the outcome you care about — vigorous growth and abundant flowering — PPFD is the more important figure, because it depends on installation conditions and not only on the fixture's datasheet numbers.
And one more thing: identical PPFD from two lamps does not guarantee an identical effect, because photons of different wavelengths do not contribute equally to photosynthesis. Look at the spectrum together with the light map, not at a single number.
If you have lux meter readings and need to convert them to PPFD, use our online lux to PPFD calculator ↗: it accounts for the spectrum of your specific lamp type.