Full Spectrum in Grow Lights or Quantum Boards — What Is It and How to Choose?
Spectrum is the distribution of photons across wavelengths. When a manufacturer states "full spectrum," it means the light contains all visible colors. But the question remains: in what proportions, and how many photons fall into the ranges the plant actually uses?
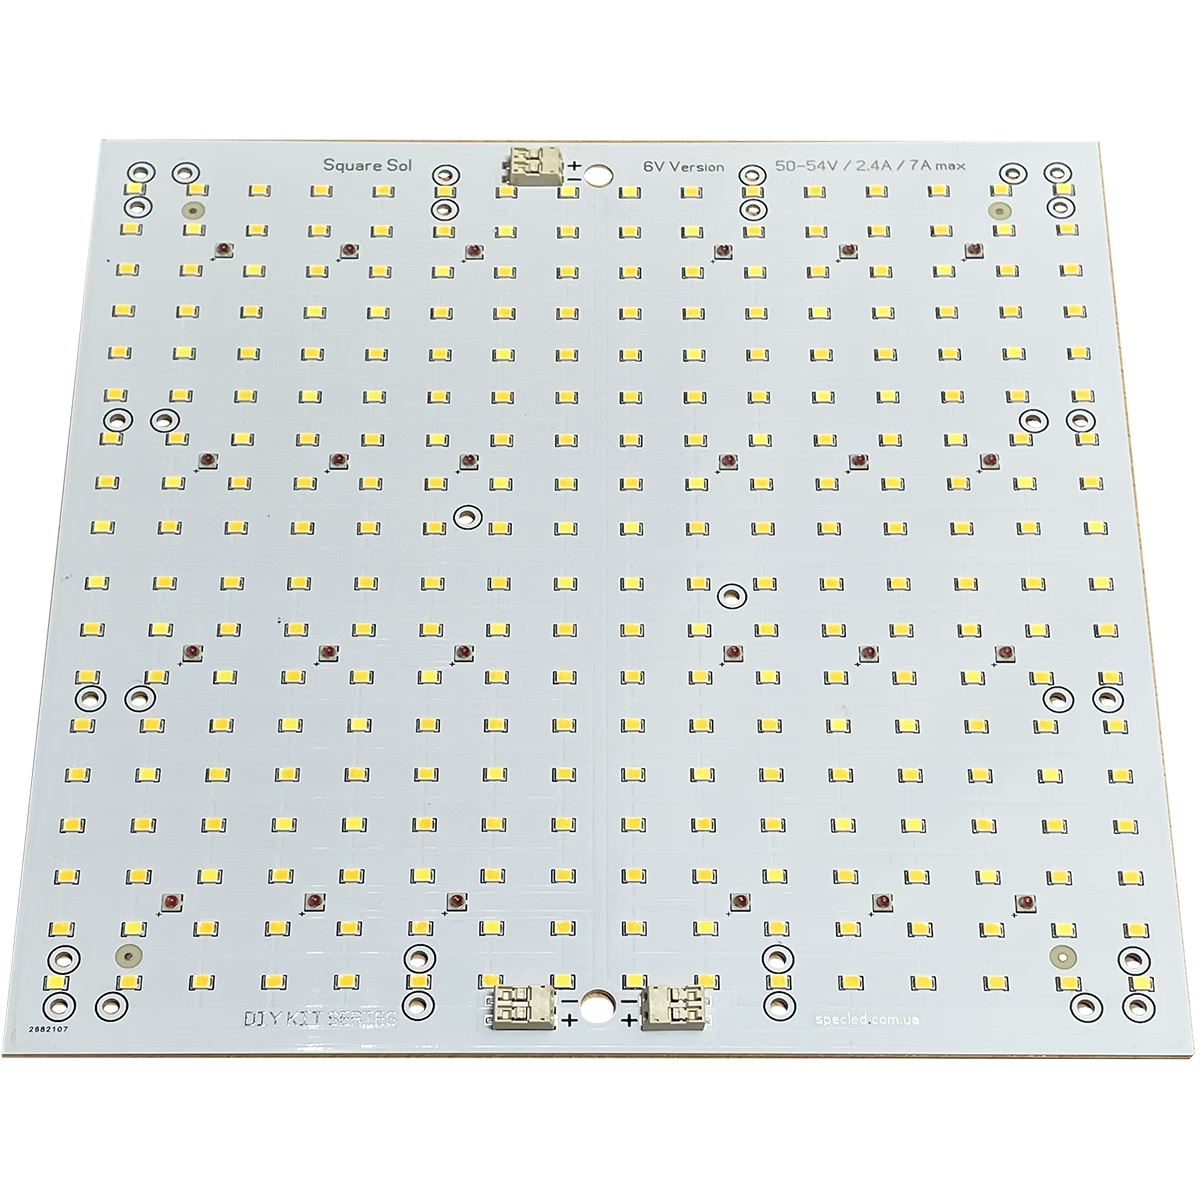
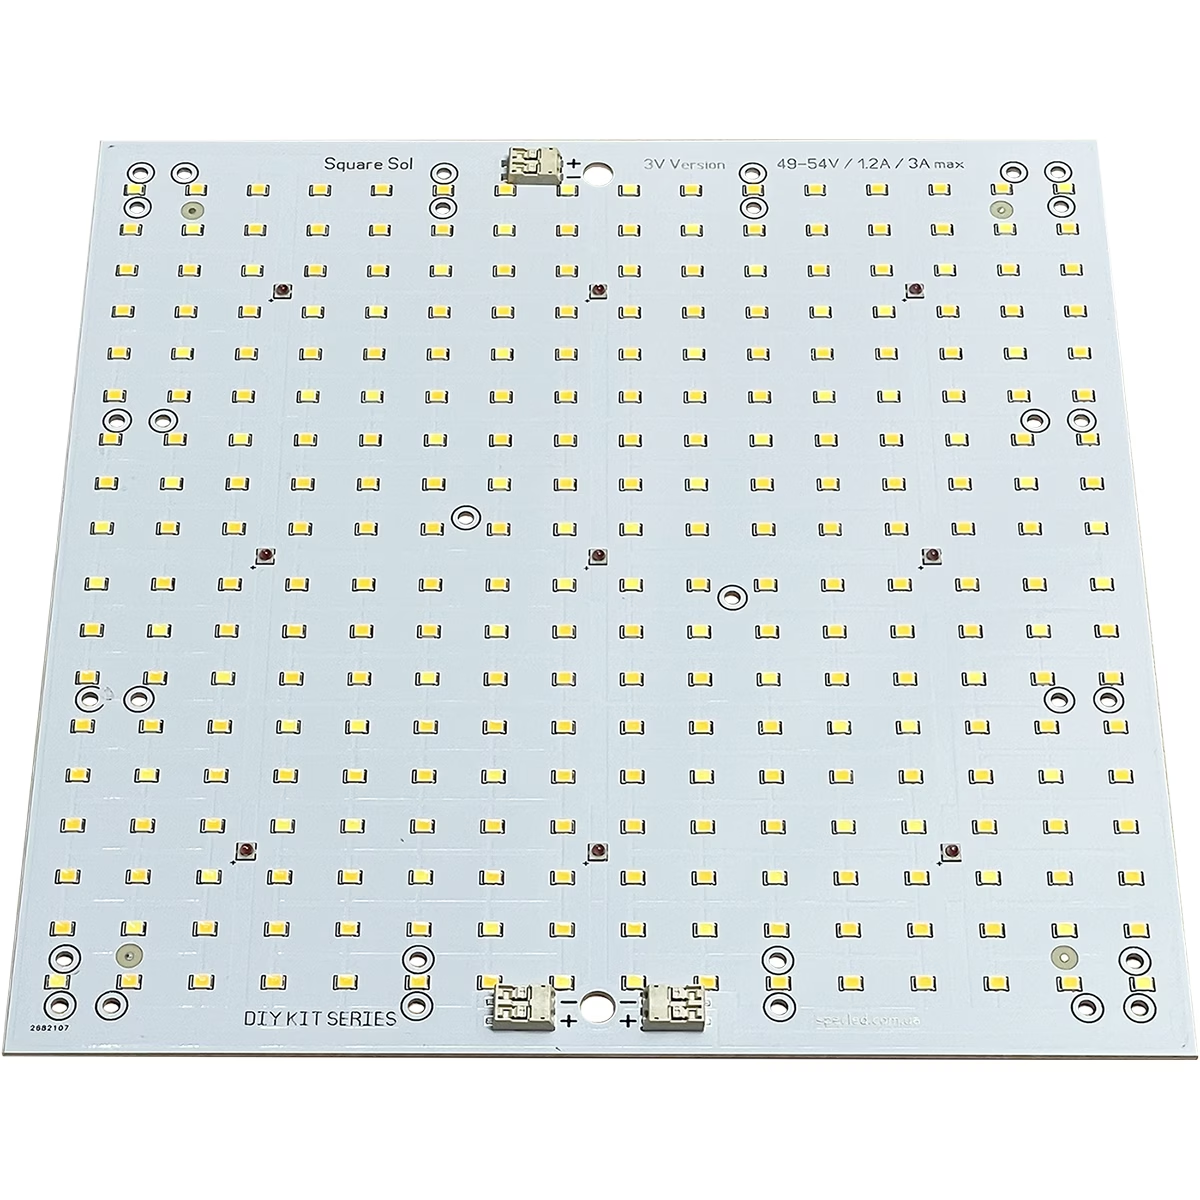
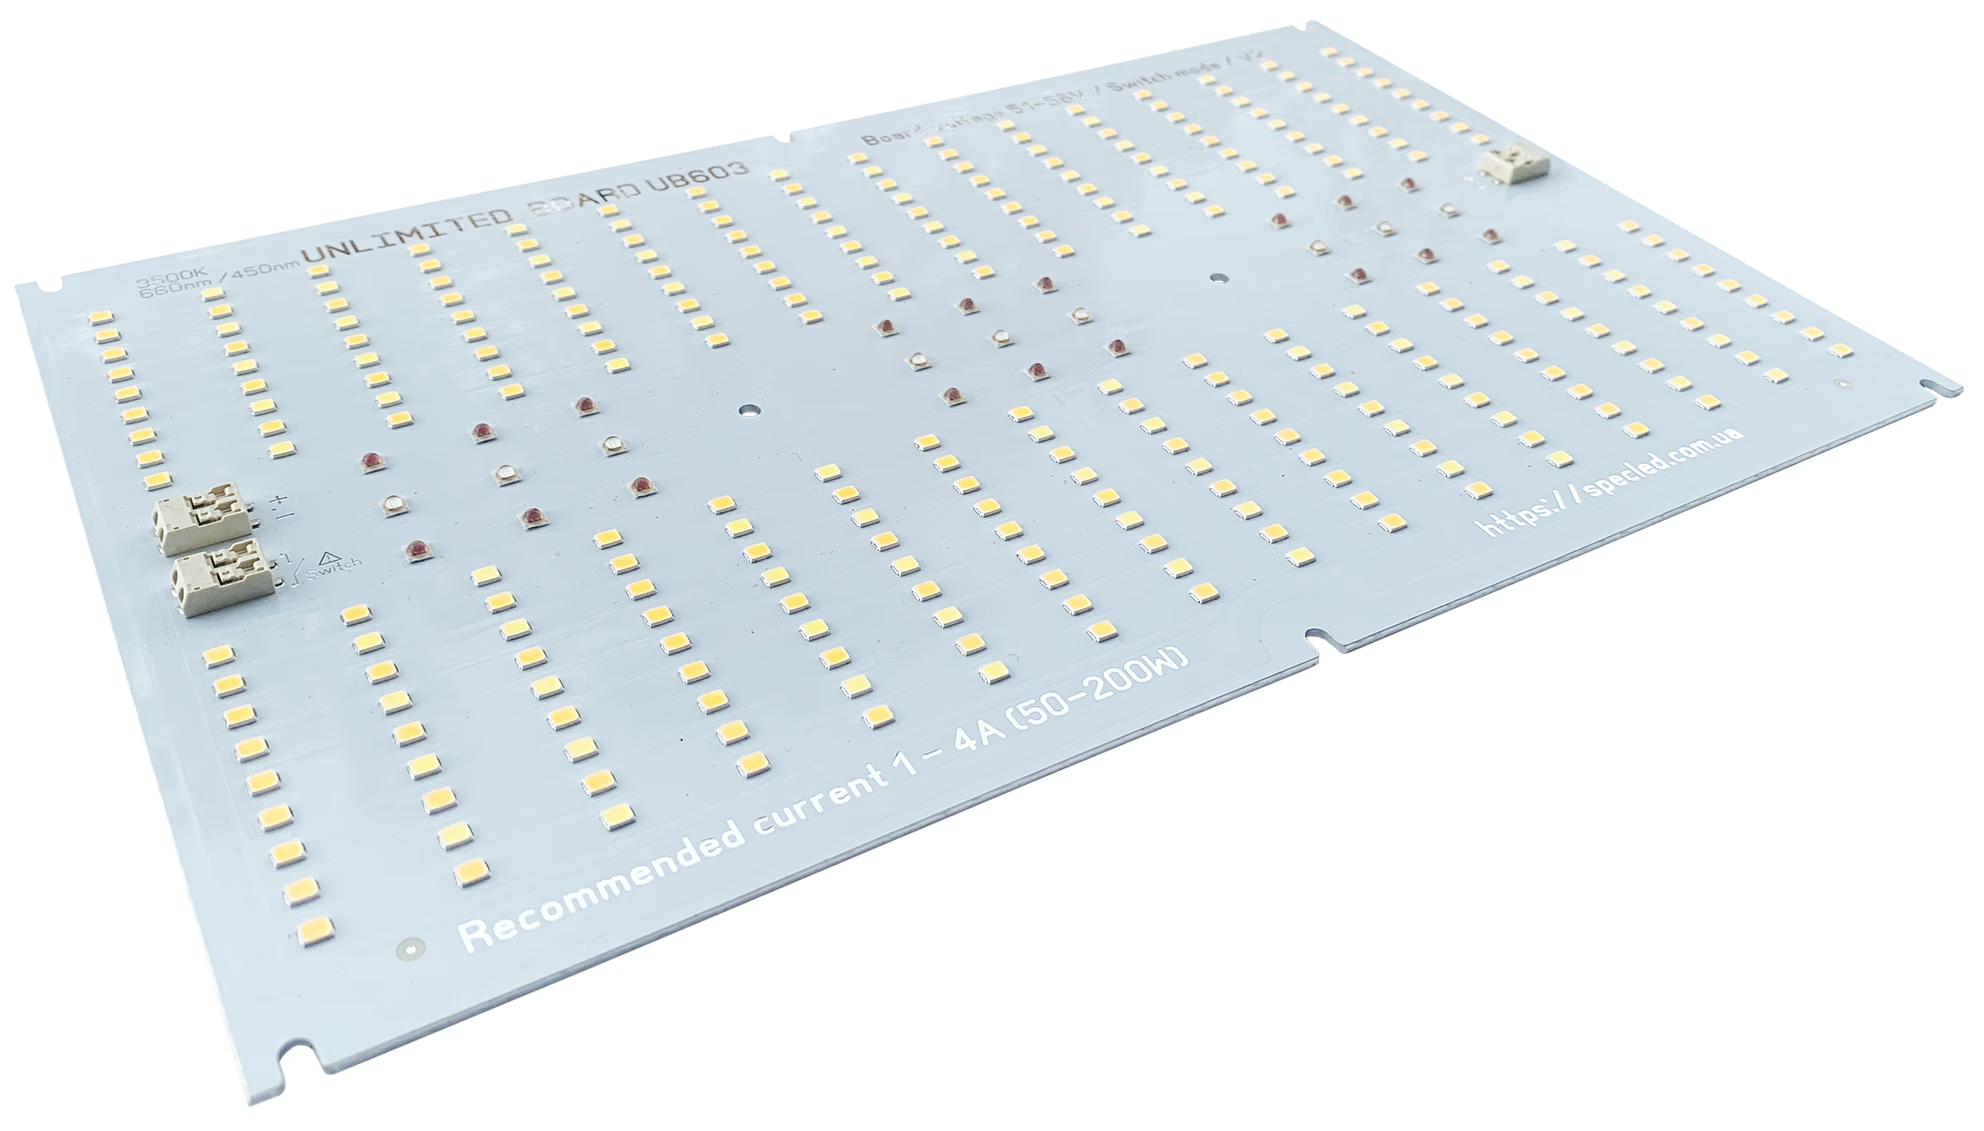
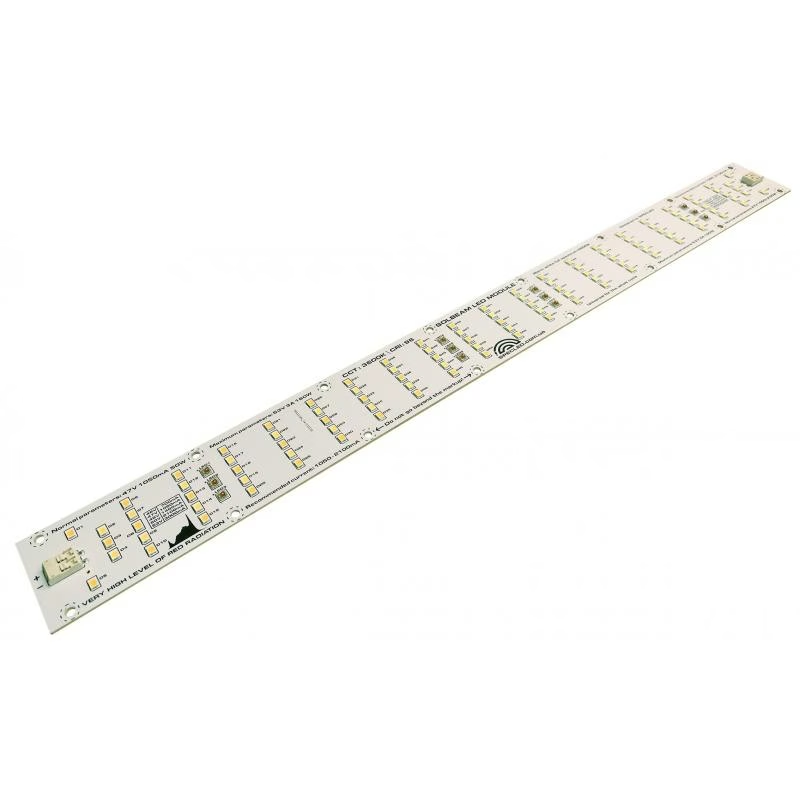
The term "quantum board" has become a household name (it sounds cool, after all) — people search for it "like crazy," making it a top query according to the Google Keyword Planner. Boards using white Cree, Samsung, or Seoul LEDs genuinely provide a high-quality full spectrum. However, the label "quantum board" alone is not a guarantee. Two quantum boards with the same wattage can have different full spectra: one board might have an enhanced red photosynthesis peak, while the other does not; one might add far-red, while the other skips it. Often, identical white LEDs are used without mixing. The difference isn't visible on the packaging — it's only visible on a spectrum graph, preferably a quantum one rather than an energetic one. That is why a grow light or quantum board should be evaluated not only by its name, power, and LED model, but also by its spectrum.
A good "full spectrum" must always, without exception, have a clearly defined additional 660 nm peak. This is a crucial spectrum peak for all stages of plant growth, excellently absorbed by chlorophylls, and significantly improves plant development. Additional supplemental LEDs (730 nm, 380 nm) are good to have but not mandatory. The most effective among these would be the 730 nm.
I would like to draw your attention, dear readers, to the fact that some overseas manufacturers often place literally 4 pieces of 730 nm and 400 nm LEDs in a 3528 format on their boards and write in large letters that the board features additional peaks, even drawing a beautiful spectrum to match — this is fake. Just 4 low-power LEDs in a 3528 or even 3030 format do not actually alter the structure of the spectrum.
Another important fact! Samsung LED is completely leaving the LED market and has already entirely ceased production of the LH351 660nm, LM301H, LM281+, and other highly popular LEDs that were used in quantum boards. An era has come to an end. Keep in mind that Chinese marketplaces will now feature 100% counterfeit products, whereas before it was only 95%. Read more about it here — why Samsung LED left the LED market↗.
Quantum Spectrum vs. Energy Spectrum: Why We Count Photons for Plants
Here is a point where people are often misled. There are two ways to display a spectrum: in energy (watts per nanometer) and in quanta (number of photons). For plants, the correct way is quantum, and here is why.
During photosynthesis, a plant reacts to the number of captured photons, not their total energy in joules. Even Einstein understood this! And the energy of a single photon is inversely proportional to its wavelength: a blue photon carries more energy than a red one. Therefore, to deliver the same power in watts, you need more red photons than blue ones. When converting the spectrum from energy to quanta, the red area "grows," and the blue area dips. The spectrum significantly changes its appearance.
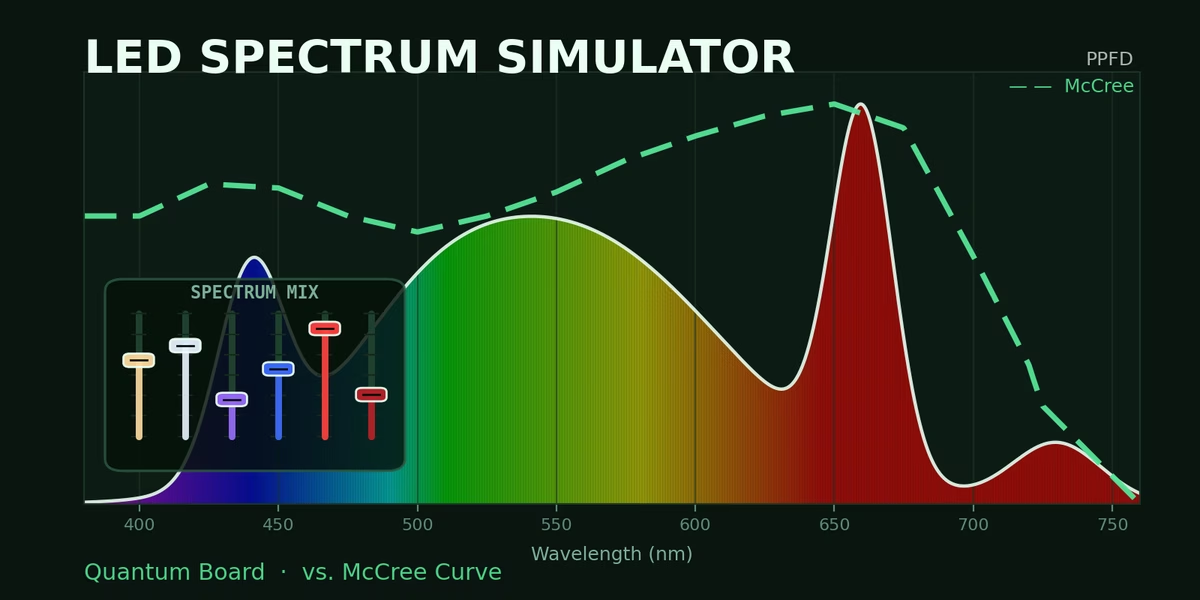
Toggle the "Quanta / Energy" mode in the simulator, and you will see how the same light fixture changes shape. The 660 nm red peak in the quantum representation becomes noticeably higher than in the energetic one. This is exactly why serious metrics for plants (PPFD, PAR) are always calculated in micromoles of photons, not in watts.
The McCree Curve: Where Photons Work Most Efficiently
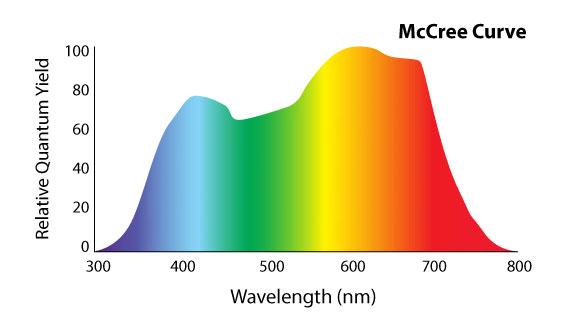
In 1972, Keith McCree measured how efficiently plants use photons of different wavelengths for photosynthesis. The result was the relative quantum yield curve — RQE, known ever since as the McCree curve. It shows that not all PAR photons are equally useful.
The curve has a characteristic shape: a peak in the blue region around 440 nm, followed by a slight dip in the green-blue zone, a gradual rise, and a main maximum in the red region around 600–620 nm, before a sharp drop off after 690 nm. This means plants use red photons most efficiently, blue ones well, and green ones slightly less so (although they penetrate deeper into the canopy).
Turn on the "Show McCree Curve" toggle in the simulator, and a yellow dashed line will overlay your spectrum. This visually demonstrates whether the photons from your lamp hit the zones of maximum yield or are wasted where the plant uses them weakly. This is an honest evaluation of the spectrum — not by the beauty of the graph, but by its match with the real needs of the plant. At the same time, we cannot say the McCree curve is ideal for all plants under all conditions. No, it's not ideal, but it is certainly 100% universal!
Key Metrics: PAR, YPF/PPF, and R:FR
Below the graph, the simulator calculates figures that turn the spectrum's shape into concrete indicators.
- PAR Fraction — how many photons fall into the photosynthetically active range of 400–700 nm.
- YPF/PPF — the ratio of the "useful" flux (weighted by the McCree curve) to the total PAR photon flux; the closer it is to one, the more efficiently the spectrum uses each photon.
- R:FR — the ratio of red (660 nm) to far-red (730 nm). This ratio controls photomorphogenesis: the plant perceives a low R:FR as "shade from neighbors" and begins to stretch, while a high ratio keeps the bush compact. The right dose of far-red accelerates flowering; in excess, it stretches the plant upward. The role of 730 nm far-red light is quite a controversial topic. For more details, see our article: The Effect of 730 nm Far-Red Light on Plant Development↗.
Adjust the channels in the simulator and watch the metrics: this is how an abstract "spectrum" turns into measurable values that allow you to compare lamps objectively.
Spectrum for Vegetation and Flowering: What to Change
Plants need different light at different stages, and the simulator shows this through presets. By the way, this is exactly why the McCree curve is universal, rather than ideal. I highly recommend clicking through the different presets in the simulator; I spent a long time fine-tuning them.
During vegetation (the "Veg" preset), there is more blue in the spectrum — it keeps internodes short, leaves thick, and the bush compact. The 440 nm blue suppresses stretching and stimulates the accumulation of green mass.
During flowering (the "Bloom" preset), the focus shifts to red: an enhanced 660 nm peak and the addition of 730 nm far-red trigger and accelerate flowering, increasing the density of the inflorescences. This is why lamps with enhanced red yield better results in the budding phase than "neutral" white panels.
Switch between presets and see how the R:FR and range fractions change — this clearly explains why the same light fixture performs differently during various phases.
Full Spectrum vs. Bi-Color: Each Has Its Purpose
Cheap bi-color (only 440 nm blue + 660 nm red, usually in a 2:3 ratio) is often criticized for being "incomplete." But this is unfair: bi-color has its own strong point — maximum efficiency (efficacy). Monochrome 440 nm and 660 nm diodes convert electricity into photons more efficiently than phosphor-coated white LEDs, so bi-color delivers more micromoles per joule (µmol/J).
For seedlings and early vegetation, this is sufficient: a young plant mainly needs basic blue and red to gain mass, and the cost-effectiveness of bi-color is a plus here. It's also great for supplemental lighting in greenhouses! They already have the sun, making bi-color act like a Quad-Turbo for plants — a super boost! However, a full spectrum wins during flowering and for crop quality: green photons penetrate deeper into the canopy and work on lower leaves, far-red manages morphology, and the fullness of the spectrum is closer to natural sunlight. Compare the "Bi-color" and "Full Spectrum" presets in the simulator — the difference in metrics is immediately visible. The conclusion isn't "what is better," but rather "what fits the task": bi-color for starting and saving money, full spectrum for the full cycle and maximum quality.
How to Use the Simulator
Move the sliders for the six channels (white 3500K and 5000K, UV-A 380 nm, blue 440 nm, red 660 nm, far-red 730 nm) — the graph and metrics update in real-time. Preset buttons (full spectrum, veg, bloom, bi-color, sun spectrum) set up typical scenarios. The "Quanta / Energy" toggle shows the difference between the two representations, and the McCree switch overlays the quantum yield curve. Build the spectrum of your lamp based on its specs and compare it with the benchmarks — this is the best way to understand what you are actually giving your plants.
If you need a professional tool to obtain the resulting spectrum of a real lamp, use the LED spectrum simulation tool↗. The tool calculates a wide variety of luminous flux metrics and provides the ability to download a full report in PDF format, which includes the final calculated spectrum.
Briefly About the Spectrum of Grow Lights
A grow light's spectrum shouldn't be judged by the word "full-spectrum" or the name "quantum board" — what matters is where the photons land and how the spectrum matches the plant's actual needs. Calculate light in quanta, not watts, refer to the McCree curve, and monitor R:FR for the specific growth phase. Bi-color is great for seedlings due to its efficiency, while full spectrum is ideal for the full cycle and quality. And if you don't want to build a lamp manually, choose a ready-made solution with a proven, measured spectrum.
To evaluate the uniformity and quality of lighting in a grow box, we have created a grow box lighting simulator↗ with the ability to generate a PAR map. You need to specify the dimensions of the grow box, the size and type of LED grow light, select the mounting height, and set several other parameters. Once the widget is configured, you can immediately see a 3D simulation of the light distribution inside the grow box.
The spectrum simulator allows you to visually see and understand how the ratio of LEDs with different wavelengths affects the structure of the spectrum, and to see the clear difference between the quantum and energetic spectrums. Figure out standard spectra and compare them with the McCree curve. You have 6 independent channels at your disposal. Enjoy! And please leave a star rating under the widget, available for authorized users. Thank you for that.