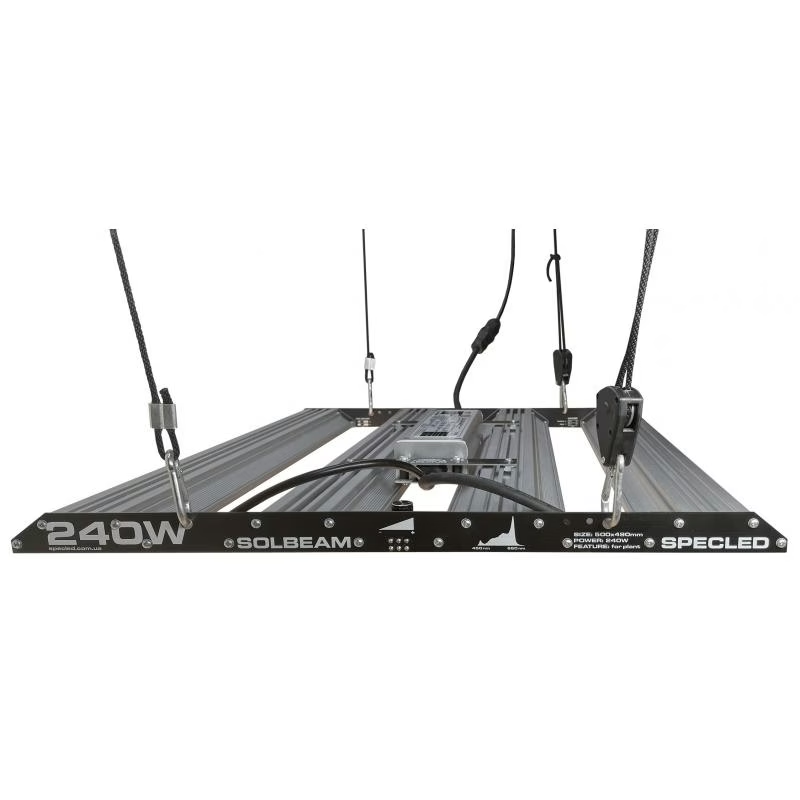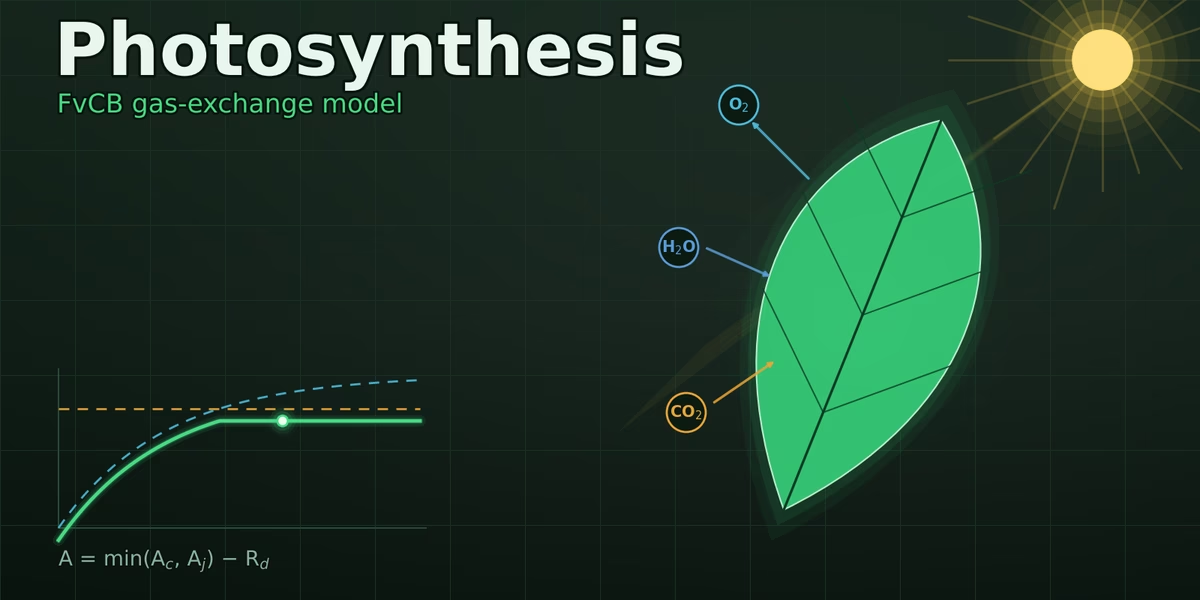
The Plant Photosynthesis Simulator is an interactive digital model, widget, or software that allows you to virtually recreate, study, and test the photosynthesis process based on various environmental conditions.
Our photosynthesis simulator can be extremely useful for evaluating and checking the microclimate in your grow box, grow room, or greenhouse. Especially if a CO2 tank and high-quality LED grow lights are used. The simulator has presets for tomatoes, lettuce, strawberries, and "medical tomatoes," which is very convenient. Our simulator is also suitable for urban farmers.
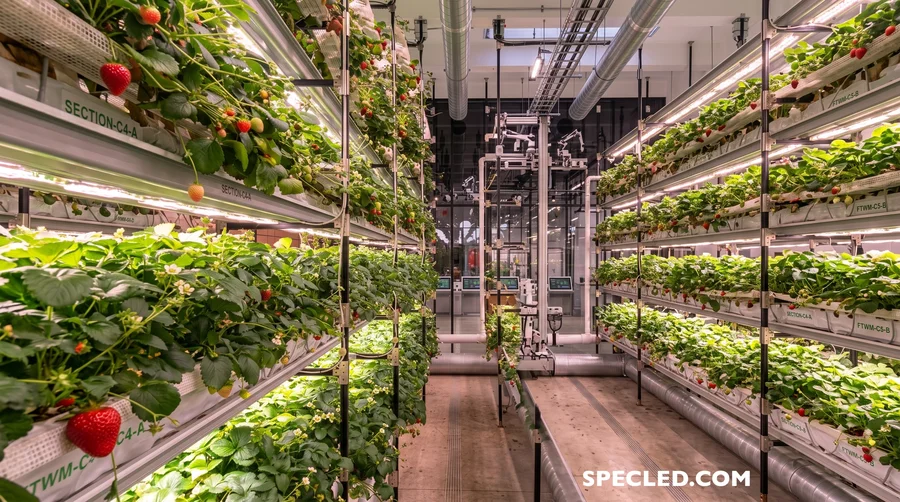
There are situations when it seems like the climate is fine, temperature and humidity are ideal, there's plenty of light, but the plants are not growing. This is where the photosynthesis simulator shows exactly which resource is currently in deficit and what will actually provide a boost, and what you will simply pay for in your electricity bill.
Before you start tweaking the sliders, it’s worth understanding the letters and abbreviations displayed on the panel.
Science Behind the Numbers: Glossary of Terms
- Photosynthesis (A, Net Assimilation) — the net rate at which a leaf binds carbon dioxide, minus what it releases through respiration. Measured in µmol CO2·m−2·s−1 — micromoles of CO2 per square meter of leaf per second. This A is what eventually turns into sugars, and sugars turn into the mass of fruits, buds (pine cones, of course, what did you think?), or greens.
- PPFD (Photosynthetic Photon Flux Density) — the density of photosynthetically active photons. This is the number of "useful" light quanta (400–700 nm) falling on a square meter per second. Plants care about quanta, not lux (which is about human vision), so we measure light in PPFD↗.
- C3-Plants — the vast majority of crops: tomato, lettuce, strawberry, "medical tomatoes." Their first CO2 fixation product is a three-carbon molecule. These plants respond strongly to CO2 enrichment, unlike C4 plants (corn, sorghum).
- Farquhar–von Caemmerer–Berry (FvCB) Model — the international standard for describing C3 leaf photosynthesis, published in 1980 and verified by thousands of studies. The core formula is: A = min(Ac, Aj) − Ra. Speed is always set by the most deficient resource — this is Liebig’s Law of the Minimum baked directly into the math.
- RuBisCO — the enzyme that "stitches" CO2 to an acceptor. It is the most abundant protein on Earth and simultaneously the main bottleneck of photosynthesis.
- Ac (RuBisCO/CO2-limit) — the maximum rate the enzyme can handle at current CO2 and temperature levels. When light is plentiful but CO2 is low, the leaf is limited by Ac — that's when CO2 enrichment helps, not more lamps.
- Vcmax(T) — the maximum carboxylation rate of RuBisCO, dependent on temperature. Think of it as the "engine displacement" of the leaf.
- Aj (Light/RuBP-limit) — the rate limited by the regeneration of the RuBP acceptor, fueled by light energy. When light is low, the leaf is limited by Aj, and adding CO2 is almost useless at this moment — there is no energy to process the gas.
- J and Jmax(T): J — the electron transport rate, the flow of energy from captured light to the biochemical "factory." Jmax(T) — its temperature ceiling. The brighter the light, the closer J gets to Jmax.
- Ra (Respiration) — leaves consume some carbohydrates day and night to stay alive, releasing CO2. Therefore, in the dark or under low light, A goes negative — the plant is releasing carbon, not storing it.
- Γ* (CO2 Compensation Point) — the concentration at which photosynthesis perfectly balances respiration (A ≈ 0). Below this point, the leaf operates at a loss.
- Ci (Intercellular CO2) — the gas concentration not in the room, but inside the leaf, in the spaces where it enters through the stomata. This is what RuBisCO actually "sees," and it is always lower than ambient CO2.
- gs (Stomatal Conductance) — how open the stomata are (the microscopic pores on the leaf). Wider stomata mean more CO2 enters, but also more water evaporates.
- VPD (Vapor Pressure Deficit, kPa) — a measure of how "dry" the air is relative to saturation. A high VPD means arid conditions: the plant closes its stomata to avoid dehydration, cutting off its own CO2 supply in the process.
- Medlyn 2011 Stomatal Link — describes the relationship between humidity, VPD, and stomatal opening. The simulator uses a clean chain: humidity → VPD → gs, and Ci is calculated iteratively from the balance of "how much CO2 entered vs. how much was processed." This makes humidity a real factor, not just window dressing.
- Bernacchi 2001 Temperature Dependencies — a set of verified formulas where each crop has its own temperature optimum and honest decline (in cold or heat), rather than just "the warmer, the better."
How to Use the Simulator
Everything comes down to choosing the crop and adjusting the four sliders.
Select your plant at the top — tomato, "medical tomatoes," lettuce, or strawberry: each has its own "engine" and optimum. Then, adjust the four sliders: Light (PPFD), Leaf Temperature, CO2, and Air Humidity. The large number in the center is the net assimilation A. The ring shows the percentage of that culture's ceiling, and the color badge tells you exactly what’s in deficit: light, CO2, or high VPD. Below are the technical values — Ci, gs, VPD, Ac, Aj, Ra, Vcmax(T), Jmax(T) — for those who want to dig deeper. Preset buttons ("Greenhouse," "CO2 Enrichment," "Dry Air," "Heat Stress") instantly load typical scenarios.
Important: The photosynthesis model only works correctly with a proper microclimate. If you've determined your leaf is "choking" due to high temperature or dryness, check your VPD parameters - go to the VPD calculator↗
What the Four Charts Show
The chart switches between four axes, and each is a separate response curve:
- A / Light — how photosynthesis grows with brightness. You can clearly see the point where the curve hits a plateau: further lighting provides almost no benefit.
- A / CO2 — response to carbon dioxide. A steep curve upward means enrichment pays off; a flat curve means you're already saturated, and adding gas is pointless.
- A / T — a temperature "bell" with an optimum and declines at the edges. Shows where heat stress or cold shock begins for that crop.
- A / Humidity — how VPD pulls everything else along through the stomata.
Each chart has three lines: amber (Ac, RuBisCO limit), blue (Aj, light limit), and green (net A). The intersection point of the amber and blue lines is where one bottleneck gives way to another. The circle on the curve shows exactly where you currently stand.
It’s a Simulator, Not a Measuring Device — and That’s Normal!
It’s important to understand: the widget doesn't measure your specific leaf. It calculates the behavior of an averaged leaf based on literature parameters, equates leaf temperature to air temperature, and doesn't account for canopy, airflow, nutrition, and growth stage. Therefore, the numbers are "where to and approximately how much," not passport values for climate setting.
However, as a logic trainer, it’s extremely visual and completely free. In a minute, you’ll see with your own eyes what usually takes years of intuition: why growth stalled at 400 ppm under bright light (hit the CO2 limit), why a leaf "chokes" in a dry box even with perfect light, and why lettuce and "medical tomatoes" have completely different optima.
Why is such a complex photosynthesis simulator needed?
Harvest is, simply put, the accumulated photosynthesis over a cycle. Every µmol of CO2, it is also the DLI parameterthe↗, leaf binds converts into future biomass. Therefore, removing a current bottleneck directly converts into mass gain: boost CO2 when the leaf is carbon-starved; fix the VPD when stomata are closed; don't burn extra light that can no longer be processed.
The main value here is saving money and avoiding mistakes. Instead of blindly "blasting everything to the max" and paying for electricity, CO2, and heat management, you first see which lever actually works in your specific situation — and only then do you turn it in the real grow box. Understanding exactly what is slowing down photosynthesis right now is the shortest path to a stable harvest.
I really hope the widget will help beginners and even advanced growers find and solve their current problems, learn something new, and level up their skills in growing plants under grow lights in grow boxes or greenhouses! Good harvests to everyone!