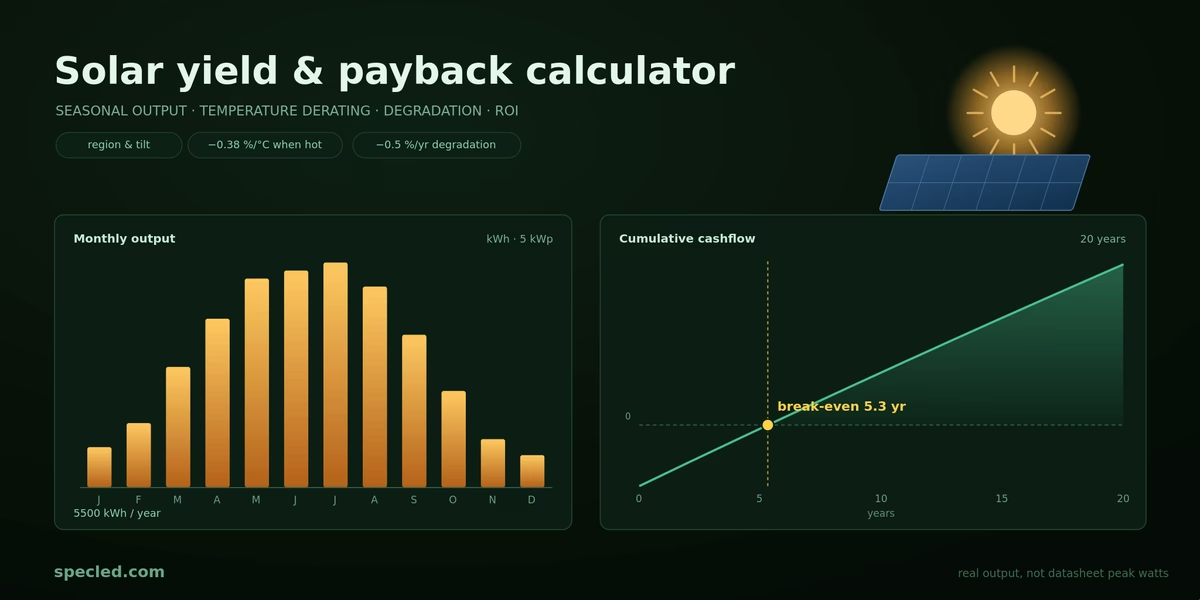
When people first think about purchasing solar panels, most start by calculating the payback period. But the standard approach is usually oversimplified: take the panel's power rating, multiply it by daylight hours, and divide the equipment cost by the resulting kilowatt-hours. On paper, everything looks fantastic—a payback period of just 3 to 4 years, free electricity, and complete energy independence. It looks like a fairy tale!
In reality, the very first year of operation brings a reality check. You quickly discover that in July, under a cloudless sky, a 400 W panel barely outputs 330 W. You realize that during overcast weather in Dublin, Amsterdam, or Berlin, panels perform nothing like they do in glossy promotional brochures from sunny Spain. Most importantly, exporting surplus energy back to the grid yields pennies compared to what you pay for every kilowatt-hour consumed during peak evening rates.
Why do 99% of online residential solar calculators get it wrong? Because they rely on primitive mathematics. More often than not, these calculators are built by marketers rather than engineers. Our interactive widget is built upon an engineering model: it accounts for atmospheric physics, panel tilt angle, daily and seasonal solar trajectories, diffuse radiation on cloudy days, regional climate data for sunny and overcast days, shorter winter days, and silicon temperature losses—as well as the real-world economics of utility tariffs and subsidies.
Accurate Solar Panel Output Calculation: 4 Hidden Loss Factors
If you check the specification sheet of any solar panel (STC — Standard Test Conditions), you will find ratings measured inside a pristine laboratory: a cell temperature of exactly 25 °C, solar irradiance of precisely 1000 W/m², and an AM 1.5 spectrum. In real-life rooftop installations, these conditions almost never exist simultaneously.
Our calculator incorporates four critical physical processes into its calculations that equipment suppliers typically ignore:
1. The Temperature Paradox (NOCT Model)
It sounds counterintuitive, but solar panels dislike excessive heat. Silicon is a semiconductor; as it heats up, its internal resistance changes, voltage drops, and overall power output decreases by approximately 0.35–0.45% for every degree Celsius above standard test temperature. This is a significant factor considering that dark solar panels absorb massive amounts of solar radiation.
On a sunny July afternoon, a black rooftop panel can easily reach 60–65 °C. This means you instantly lose 12% to 15% of your nominal rated capacity purely due to heat. The ideal weather conditions for photovoltaic generation are actually freezing, crystal-clear days rather than summer heatwaves. Our algorithm utilizes NOCT (Nominal Operating Cell Temperature) calculations, ensuring that your projected summer generation curve remains realistic rather than overly optimistic.
2. Direct vs. Diffuse Radiation (Erbs and Klucher Models)
For residents of Northern and Central Europe (Ireland, the UK, the Netherlands, Germany), clear sunny days are more of an exception than the norm. In cities like Dublin or London, the sky is overcast for a significant portion of the year.
Basic calculators simply scale down power linearly based on cloud cover percentages. But atmospheric physics is more complex: as light passes through clouds and the atmosphere, it scatters. A panel captures not only direct solar beams but also diffuse radiation across the entire sky dome, along with albedo (reflection from the ground and adjacent rooftops).
We integrated the Erbs radiation separation model and the Klucher transposition model into our algorithm. These mathematical models accurately calculate exactly how much diffuse radiation strikes an inclined panel surface—even on days when the sun is completely hidden behind thick clouds.
This level of mathematical depth ensures our widget serves as an engineering tool, rather than a promotional trick promising unrealistic future savings.
3. Solar Panel Tilt Angle and Azimuth: Optimizing for Household Usage
The classic rule of thumb states that solar arrays should face due south (azimuth 180° in the Northern Hemisphere) at an angle of roughly 30–35° (depending on regional latitude). That orientation will indeed maximize your total annual kilowatt-hour yield.
For agronomists, we have a simulator that models the sun's movement at different times of the year. The widget calculates the amount of light the sun provides throughout the day↗ at different times of the year, at different latitudes, with simple weather modeling.
However, ask yourself a practical question: when exactly do you need that electricity? Unless you invest in expensive home battery storage, peak solar generation from a south-facing roof at 1:00 PM is largely wasted—you are at work, and only the refrigerator, router, and standby appliances are drawing power. By the time you return home to run the stove, washing machine, water heater, home lighting, and charge your EV, the sun is already setting.
- East–West Split Orientation: By splitting your array across two roof slopes, you sacrifice a small percentage of total annual yield in exchange for a broader, flatter generation curve. Electricity starts flowing early in the morning and continues until late evening, perfectly overlapping with typical household consumption profiles.
- Winter Optimization Tilt: If your primary objective is maintaining winter energy autonomy, a steeper tilt angle (45–50°) is preferable to capture low winter sun angles and naturally shed snow.
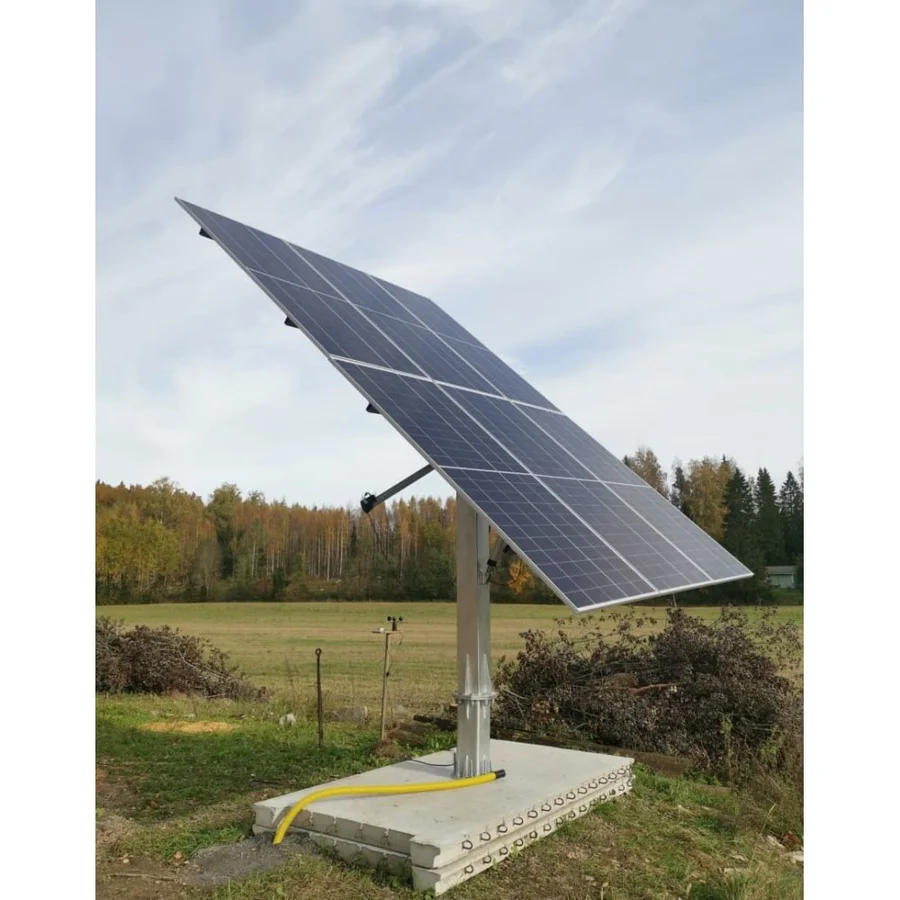
Solar Trackers: Automated systems that orient panels toward the sun throughout the day can increase total energy generation by 15–30%, though they are significantly more expensive and require dedicated ground space.
4. Inevitable Silicon Degradation (0.5% per Year)
No solar panel lasts forever. Under the stress of UV radiation and thermal cycling, silicon photovoltaic cells gradually degrade. High-quality modern modules lose approximately 0.5% of their efficiency per year. In our financial evaluation block, this wear and tear is factored into the 25-year balance: our calculator does not assume your array will perform like new two decades from now—after 10 years, panel efficiency naturally drops by around 5%.
The Financial Trap: Why Payback Calculations Are Often Misleading
Engineering generation numbers are only half of the equation; the other half is your electricity supplier's billing structure. This is where the biggest financial misconceptions reside.
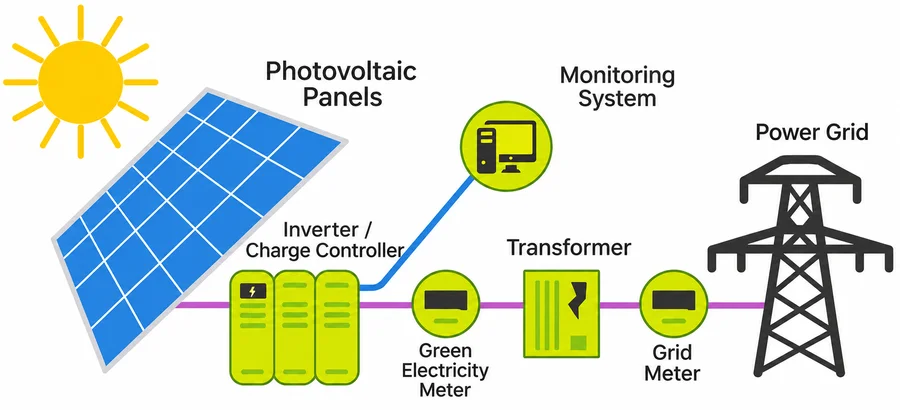
[Solar Panel Array] ---> (100% Generation)
        │
        ├─► [Self-Consumption: 40-60%] (Savings: Full retail tariff, e.g., €0.35/kWh)
        │
        └─► [Grid Export: 40-60%]      (Income: Export/feed-in tariff only, e.g., €0.20/kWh)
The 100% Self-Consumption Myth
Many homeowners multiply their entire projected solar yield by their current retail electricity rate. This is a costly oversight. Without home battery storage, a typical household consumes only about 30–40% of its solar generation directly as it is produced.
The remainder is exported back to the grid. While you might purchase power from your utility for €0.35 per kWh, they typically buy back your surplus under a feed-in tariff at just €0.15–€0.20 per kWh—or in some regions, for nothing at all. Occasionally, the reverse occurs: green energy export tariffs can exceed retail purchase prices, making exporting more profitable than self-consumption, as has been the case in Ukraine for some time.
In our calculator, you can adjust the Self-consumption slider to match your actual household usage profile:
- 20–30%: Your home is empty during the day, everyone works on-site, and there is no automated load scheduling.
- 50–60%: You work remotely, schedule washing machines and dishwashers to run mid-day, or operate continuous indoor equipment (such as ventilation and horticultural lighting in a grow tent).
- 80–100%: You utilize a heat pump, charge an electric vehicle, or operate a battery energy storage system that absorbs surplus solar energy.
The Impact of Grants and Government Subsidies
Across Europe, payback periods for residential PV systems have shortened dramatically—not only because panel prices have fallen, but also due to robust government financial incentives.
For example, in Ireland, the SEAI (Sustainable Energy Authority of Ireland) grant program offsets a substantial portion of upfront capital costs for domestic installations. In Germany, Austria, and the Netherlands, homeowners benefit from preferential tax treatment (such as 0% VAT on solar components) or direct subsidies.
This is why we separated the Grant / subsidy input field: when government incentives cover 20% to 50% of your initial investment, realistic payback periods drop from an intimidating 8–10 years to an attractive 3–5 years. In scenarios where hardware is sized specifically to optimize grant coverage, the net investment can break even almost immediately.
How to Use Our Online PV Generation Calculator: Step-by-Step Guide
We designed this tool so you can run accurate engineering estimates in just two minutes—without navigating complicated Excel spreadsheets or registering on specialized industry portals.
- Select your Region: Choose the city whose climate best matches your location (from cloudy Dublin and London to sunny Madrid, Athens, or Kyiv). The calculator automatically imports regional statistical data for clear, partly cloudy, and overcast days.
- Define Roof Geometry:
- Panel tilt: 0° represents a flat roof; 90° represents a vertical wall. For most pitched roofs in Europe, the optimal angle lies between 30° and 40°.
- Azimuth: Leave this at 180° if your roof slope faces due south. If it faces east, enter 90°; for west, enter 270°.
- Select Module Type and Quantity:
- We include three standard module dimensions: classic residential panels (1.65 m², ~350 W), modern high-output modules (1.94 m², ~400–430 W), and large-format commercial panels (2.58 m², ~500+ W).
- Specify the average efficiency (Panel efficiency). Modern premium monocrystalline lines operate at around 20–22% efficiency, followed by a 0.5% annual degradation rate.
- Configure Economic Parameters:
- Enter your actual retail import tariff (Price per kWh) and the feed-in tariff paid for surplus exported energy (Export price).
- Use the slider to estimate your self-consumption percentage.
- Input your total equipment purchase cost and any applicable government grant or subsidy.
The output provides more than an abstract annual yield number; you receive a monthly histogram chart illustrating exactly how many kilowatt-hours to expect during a dreary December versus a sunny July, alongside a 25-year financial balance forecast.
Solar Panels + High-Output Horticultural Lighting: An Ideal Synergy
Why host a solar output calculator on a website dedicated to lighting, LEDs, and electrical engineering? Because indoor agronomy, greenhouses, hydroponics, and urban farming are energy-intensive endeavors.
High-powered LED grow fixtures (consuming anywhere from 300 to 1000 W per square meter), ventilation fans, and irrigation pumps must operate 12–18 hours a day. Under European electricity tariffs, monthly power bills often become the primary limiting factor for overall profitability.
This is where photovoltaic generation reveals an exceptional synergy:
- Matched Load Curves: Plants require peak light intensity during the day—which coincides perfectly with peak solar panel output. Powering LED drivers directly from your solar array can elevate your self-consumption rate to 80–90%, bypassing unfavorable export tariffs.
- Low-Voltage DC Architectures (12 V / 24 V / 48 V): Many LED grow arrays and greenhouse automation systems operate on direct current (DC). Since solar panels natively generate DC power, well-designed systems can eliminate double-conversion losses (DC -> AC -> DC) by connecting DC loads via smart charge controllers.
- Attention to Wire Gauge: As discussed extensively in our article on selecting wire gauges for 12/24 V systems↗, low-voltage power distribution at high wattages requires managing massive electrical currents. Rooftop solar arrays represent an area where undersized cabling or ignoring voltage drop can cost you 10% of your total energy harvest—or even cause connector overheating and electrical fires.
PVGIS vs. Our Widget: What is the Difference?
Engineers frequently ask: "Why build a custom widget when the European Commission's official PVGIS calculator is readily available?"
PVGIS is an outstanding scientific instrument supported by over 20 years of meteorological data. However, it was built by researchers for researchers. Its complex interface can easily overwhelm general users, and it completely lacks a flexible financial layer—it does not model export tariffs, local government subsidies, equipment capital expenditures, or interactive payback visualizations.
Our calculator leverages the same underlying physical and mathematical principles (irradiance models, temperature corrections, and air mass calculations) but wraps them in an intuitive, accessible interface. Adjust a slider, and you can see instantly how a 5-degree change in roof tilt will impact your finances over the next decade.
Key Advice Before Ordering Equipment
No online calculator—whether ours or a government tool—can replace an on-site evaluation by a qualified installer. Software cannot know that at 4:00 PM, a neighboring oak tree or chimney casts a shadow across half of your roof slope (and partial shading without microinverters or DC power optimizers can severely degrade the output of an entire string of panels).
Treat this widget as your primary engineering compass. If the math checks out under honest self-consumption, tariff, and cloud cover assumptions—showing a sensible payback period of 4 to 6 years—it is time to commission a detailed engineering plan and submit your subsidy application.
If you plan to use solar energy to power high-power LED modules↗ for cultivation, remember to verify your wiring configurations with our wire size calculator↗ so that every solar-generated watt reaches your plants rather than heating up the surrounding air.
Finally, while we strongly advocate for green renewable energy, eco-friendly generation, and environmental stewardship, we believe everyone should understand the lesser-known environmental footprints behind this seemingly pristine technology:
- Silicon Tetrachloride (SiCl4): This is a major toxic byproduct of polysilicon refining. For every 1 metric ton of refined solar-grade silicon, up to 3–4 tons of silicon tetrachloride are produced. If manufacturing facilities fail to implement closed-loop recycling processes (as has occurred in lower-cost production facilities), this compound reacts with moisture to form hydrochloric acid, contaminating soil and groundwater.
- Carbon Payback Period: Smelting quartz requires industrial furnace temperatures of roughly 2000 °C. Because a vast majority of the world's solar cells are manufactured in China—where grid power remains heavily reliant on coal combustion—a photovoltaic panel must operate for 1.5 to 3 years simply to offset the greenhouse gas emissions generated during its production and shipping.
- Toxic Chemistry: The chemical etching and texturing of solar wafers utilize hazardous substances, including hydrofluoric acid, nitric acid, and industrial alkalis.