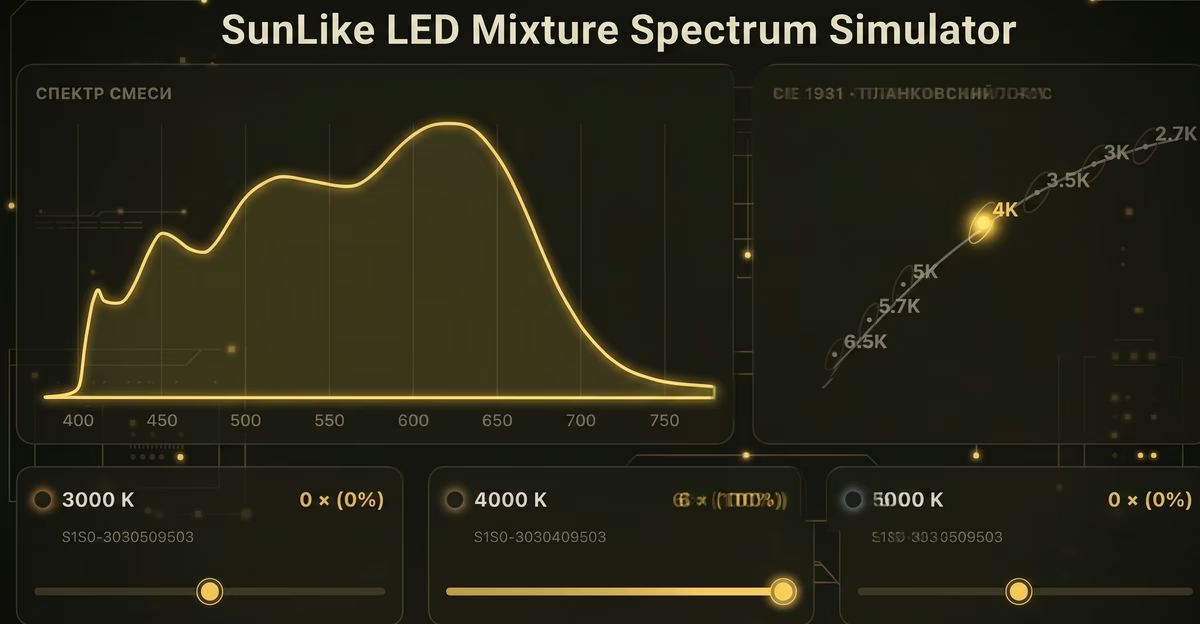
Welcome to the ruthless world of colorimetry under the sun of SunLike LEDs by Seoul Semiconductor.
The problem is that LED mixing (CCT mixing) isn't just about adding two numbers together. You can't take a 2700K diode, add a 6500K diode to it, divide by two, and expect to get a reference 4600K. The physics of light works differently. To stop reading the coffee grounds and wasting budget and time on failed prototypes, we created the SunLike LED Spectrum Mixer (a calculator widget by SpecLED).
Let's figure out why mixing LEDs by saying "this looks about right" is a bad idea, and how our widget helps lighting engineers, growers, and fans of high-quality lighting with a smooth solar spectrum. For a visual simulation of the light spectrum, you can also use our LED grow lamps spectrum simulator↗ and clearly see how changing the ratio of LEDs affects the actual spectrum.
Why mixing LEDs with different color temperatures is a lottery?
In the circles of hardcore flashaholics and DIY engineers, there's an unspoken rule: never trust color temperature numbers without looking at the tint. Two different LED arrays with the exact same CCT (Correlated Color Temperature) rating can emit completely different light. The culprits are two parameters that mass-market marketers prefer to keep quiet about. Otherwise, if you dig deeper, the lighting market looks pretty grim.
The problem of deviating from the Planckian Locus (Duv)
Remember the CIE 1931 chromaticity diagram (everyone remembers, right?). Here is the chart below.
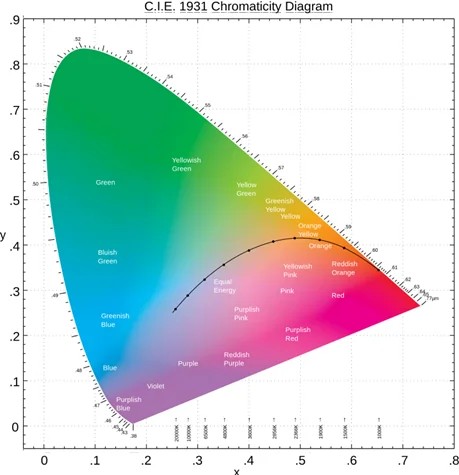
A curved line passes through it — the Black Body Locus (BBL). This is the gold standard. It is along this curve that the color of sunlight changes throughout the day.
Duv (also denoted as Duv or Δuv) is the shortest distance on the CIE 1960 (uv) color space diagram from the measured chromaticity point of a light source to the Planckian locus.
The Duv (Delta u, v) parameter shows how far your LED's light deviates from this ideal curve.
- If the Duv is positive, the point moves above the curve — the light takes on a nasty "greenish" tint.
- If the Duv is negative, the point drops below the curve — the light falls into magenta (a purplish-pink tint).
When you take two LEDs with a perfect Duv = 0 (meaning they lie exactly on the Planckian curve) and mix them, the resulting chromaticity point does not follow the curve. It follows a straight line (chord) connecting these two diodes on the chart. And a straight line between two points on an arc always passes below it!
The bottom line: any CCT mixing inevitably plunges your final Duv into negative values. Sometimes a slight shift into magenta makes the light look "crisper" (crisp white), but if you overdo it (e.g., mixing 2700K and 6500K in equal parts), you get light that makes human skin look like it has a severe sunburn. Great for those selling meat — essentially an old marketing trick you can spot in almost any grocery store.
MacAdam Ellipses (SDCM)
Even within a single batch of LEDs from the same factory, there is a variation in tint. Manufacturers sort them into what are known as MacAdam ellipses (or steps). 3 steps (3 SDCM) is premium; the human eye can barely see the difference. 5-7 steps is an AliExpress lottery.
By mixing LEDs without prior calculation, you risk blowing past the 3-step MacAdam limit for your target temperature, and ending up with light that doesn't fit into any standards of comfortable lighting.
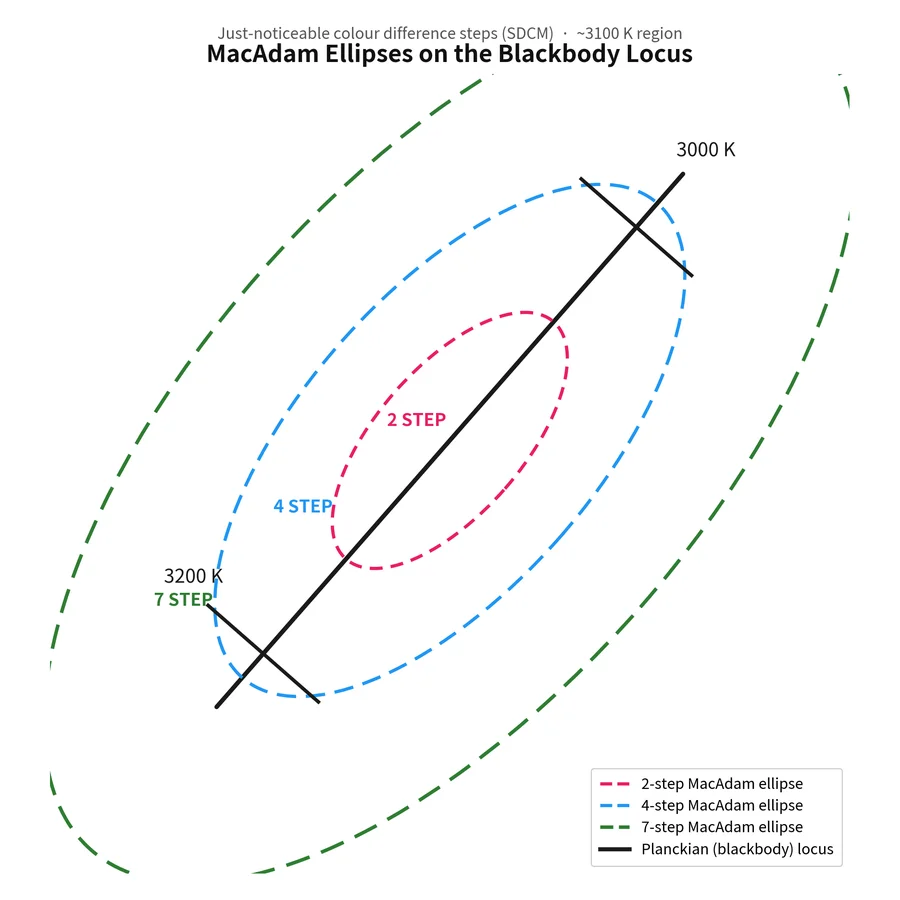
The core issue is that two identical, side-by-side luminaires with the exact same color temperature rating can produce noticeably different tints because they differ by 5+ steps. In some cases, this can visually fragment a space, distort colors, and look completely unnatural!
SunLike LED Spectrum Mixer features overview
The widget available on SPECLED.COM is a tool that helps save time and grasp lighting theory quickly and easily! The widget is built using the spectral models of Seoul Semiconductor SunLike (3030 form factor). Our widget isn't just a calculator; it's a full-fledged spectrum simulator running right in your browser.
Let's break down its main features.
Manual mix mode
In this mode, you prototype without a soldering iron. You have your "ingredients" — SunLike LEDs in three base temperatures (3000K, 4000K, 5000K) and four additional temperatures (from warm 2700K to cold 6500K). You set the proportions (e.g., two 3000K diodes and one 5000K diode), and the calculator renders in real-time:
- Final spectrum chart (SPD - Spectral Power Distribution): You instantly see the resulting spectrum and check for any nasty spikes or dips.
- The point on the CIE 1931 chart: It visually shows where the chromaticity has "shifted" relative to the Planckian locus.
- Exact numbers: The final Correlated Color Temperature (CCT) and that very Duv value.
No more physical prototyping; you can model everything visually!
Find best mix function — the killer feature
A powerful feature of the widget. Let's say you need the perfect light for a home office at exactly 4200K.
Instead of dragging sliders in manual mode, trying to guess the proportions, you switch to the "Find best mix" tab. You set the target CCT (4200K), hit the button, and the algorithm itself iterates through all possible combinations of SunLike LEDs. It will give you the perfect recipe (e.g., 4 x 4000K diodes + 1 x 5000K diode) that will deliver the required temperature with the lowest possible Duv deviation. This is pure math that saves days of engineering work. It's important to note that the "Find best mix" mode works with two LEDs; the result is always a ratio between two different color temperatures out of the seven built-in models!
How Seoul Semiconductor's SunLike series changed the game
Seoul Semiconductor, together with Toshiba, were the pioneers! They created the TRI-R (Tri-R Radiation / Ray) technology — a combination of three principles for reproducing natural light. TRI-R technology made it possible to obtain an LED emission spectrum that is highly linear and closely mimics the shape of the solar spectrum, achieving a Color Rendering Index (CRI) of ~98.
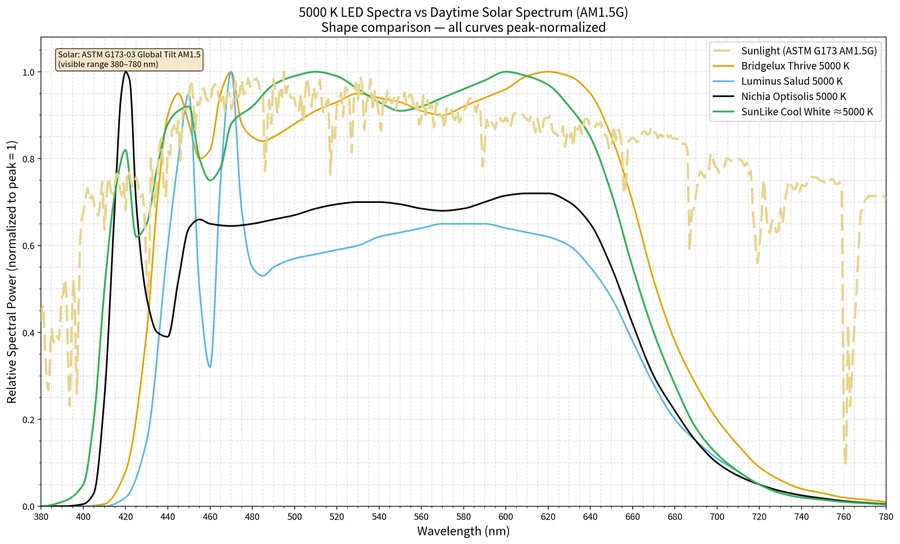
That is exactly why our spectrum simulator is tailored for the SunLike series LEDs. These LEDs represent the benchmark spectrum in the LED market. Eight years later, the SunLike spectrum remains the gold standard, despite the emergence of competitors from Nichia Optisolis, Osram Quantum Dots, Bridgelux Thrive, and Luminus PerfectWhite. For more information on SunLike technology and the use of solar spectrum for plant lighting, please read our article: SunLike LEDs, TRI-R technology, and the application of SunLike LEDs for plant lighting↗.
The image shows the spectra of four types of high-color-rendering LED series with linear spectra from different manufacturers, as well as the spectrum of the sun for comparison. The spectrogram clearly shows that the spectrum of SunLike LEDs is the broadest and most linear.
CRI, TM-30 indices, and the absence of the "blue peak"
Standard white LEDs have a simple design: a blue die covered with yellow phosphor. Because of this, their spectrum chart always features a giant "blue peak" (around 450 nm), followed by a deep dip in the cyan range (480 nm). This kind of light causes eye strain, disrupts circadian rhythms (suppresses melatonin), especially in cooler temperatures, and distorts colors.
SunLike technology by Seoul Semiconductor and Toshiba Materials takes a fundamentally different approach: a purple die (Tri-R) excites a complex three-component phosphor. The result? A spectrum practically identical to sunlight. No blue spike, no cyan dip. The CRI exceeds 97, and modern TM-30-15 metrics (Rf and Rg) show perfect saturation and color fidelity.
TM-30-15 is a modern method for evaluating the color rendering quality of light sources, developed by the Illuminating Engineering Society of North America (IES).
I believe that blindly mixing premium LEDs is a crime against physics. The SpecLED widget uses exact spectrophotometric data specifically from SunLike dies.
Practical case study: Building a SunLike workspace light
Imagine you're a content creator, and you need a custom lighting panel for your setup. You want an energizing 4200K, but with perfect skin tone rendering for YouTube streams or video recording.
Common mistake scenario: you grab cheap mainstream strips: a 2700K strip and a 6500K strip. You run them at 50/50. The light seems to be around 4000K, but people's faces look like they haven't slept in a week. Why? Because the straight line between 2700K and 6500K on the chart sags heavily below the Planckian curve. The Duv drops into a hard negative (-0.008 or lower).
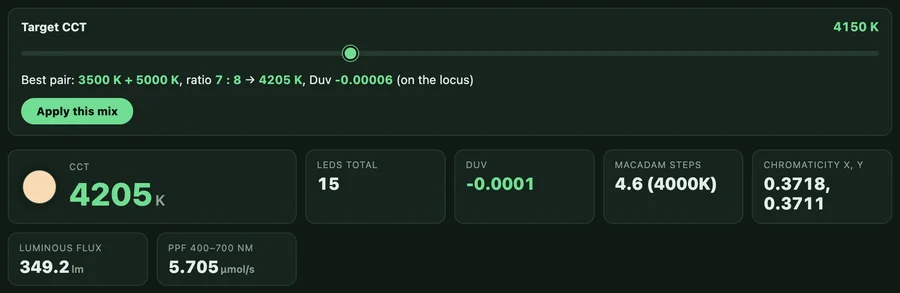
The right logic: You open the calculator, select "Find best mix," and set the target to 4200K. The tool understands that mixing extreme values is a no-go. It offers a solid base: a mix of 3500K and 5000K in a 7:8 ratio to flatten the spectral curve. As a result, you get light with a Duv of -0.0001 (a slight, highly pleasing high-contrast white) and an incredibly smooth spectrum. You order the right components, get a PCB made, and achieve studio-grade lighting!
Conclusion:
The era of choosing LEDs by shining them on a piece of white paper is long gone. Modern colorimetry does not tolerate guesswork. If you are investing money in premium components on the level of Seoul Semiconductor, use the appropriate engineering tools.
The SunLike LED Spectrum Mixer is a highly specialized but powerful widget. It takes over the most tedious part of the job — the mathematical calculation of mixing spectral power distributions. It protects you from MacAdam step errors and prevents your light from slipping into sickly green or neon magenta. Bookmark this calculator — if you work with high-quality light, it will save you both time and money.
To facilitate the simulation and modeling of classic grow light spectra, we have developed a spectrum simulator for the OSRAM Osconiq P3737 LED array↗. This simulator features the complete line of OSRAM OSCONIQ LEDs engineered for horticultural lighting, alongside two high-efficiency standard white LEDs with color temperatures of 3000K and 5000K. The interactive widget is designed to streamline the engineering and design of LED modules for plant cultivation and grow lights.
🌍 Read this article in other languages:
🇩🇪 Deutsch | 🇪🇸 Español | 🇫🇷 Français