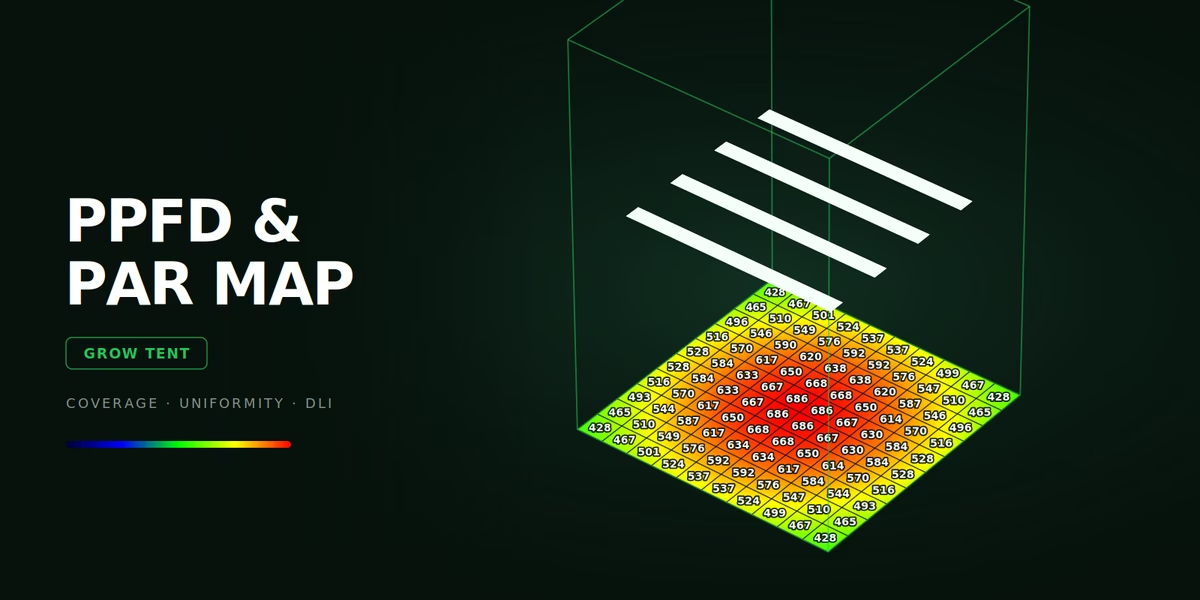
This PPFD calculator shows what your light actually delivers to the canopy — not the number on the box, but the photon flux density at every point of the tent floor, how evenly it spreads, and the daily light integral your plants end up with. Set the tent, describe one fixture, and the map appears. Switch on the grid and you get a PAR map you can hold against the one printed on the manufacturer's page.
The calculator sits on this page. If you would rather keep it open beside a product listing while you compare fixtures, the Grow Tent PPFD & DLI Simulator↗ opens as a standalone page in a new window.
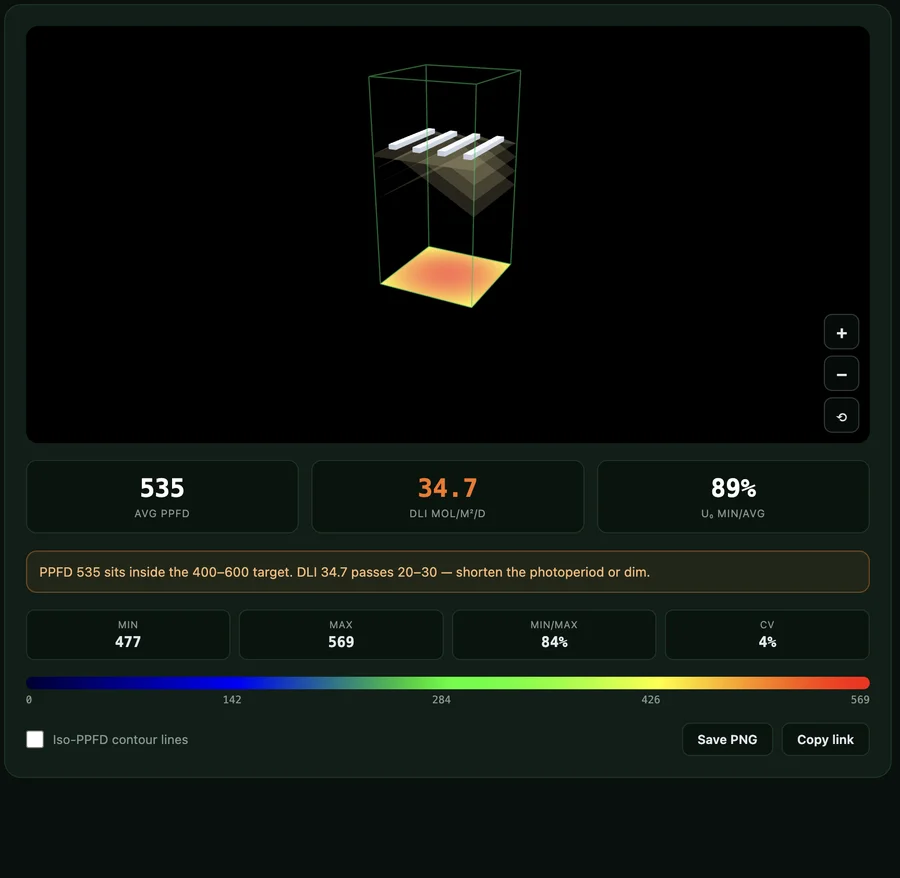
What the calculator works out
| Result | Meaning |
|---|---|
| Average PPFD | Mean photon flux density over the evaluation area, µmol/m²/s |
| DLI | Daily light integral, mol/m²/day, from your photoperiod |
| U₀ | Uniformity, minimum divided by average |
| Min / Max | Darkest corner and brightest spot |
| Min/Max | The ratio growers usually quote |
| CV | Coefficient of variation — how patchy the coverage is |
| PAR map grid | PPFD at the centre of each cell, 3×3 to 6×6, laid over the floor |
A 3D view shows the tent, the fixtures, their beam solids and a false-colour map of the floor. The dark corners are visible rather than inferred from a single average.
How to use it
1. Pick the tent. Presets cover the common sizes — 60×60, 80×80, 100×100, 120×60, 120×120, 150×150 and 240×120 cm — or set width, depth and height by hand. There is a metric/imperial toggle, so 4'×4' works as well as 120×120.
2. Leave the reflective walls on unless you are modelling an open frame. Mylar returns a real share of the light that would otherwise hit the wall.
3. Choose the fixture type. A COB point source, a panel with its own width and depth, or bars — one to eight of them, running along either axis, with an adjustable gap. Bars are what most modern fixtures actually are, and being able to move them is what makes a grow tent light calculator more useful than a coverage chart printed for one fixed layout.
4. Enter PPF per fixture, not for the whole system. This is the number on the datasheet, in µmol/s. A 150 W panel is around 300 µmol/s; a 450 W fixture around 1200; a big 650 W board around 1800. The calculator shows the system total underneath so you can sanity-check it.
5. Set the hanging height. This is the single most influential control. Everything else being equal, halving the height roughly quadruples the peak and wrecks uniformity.
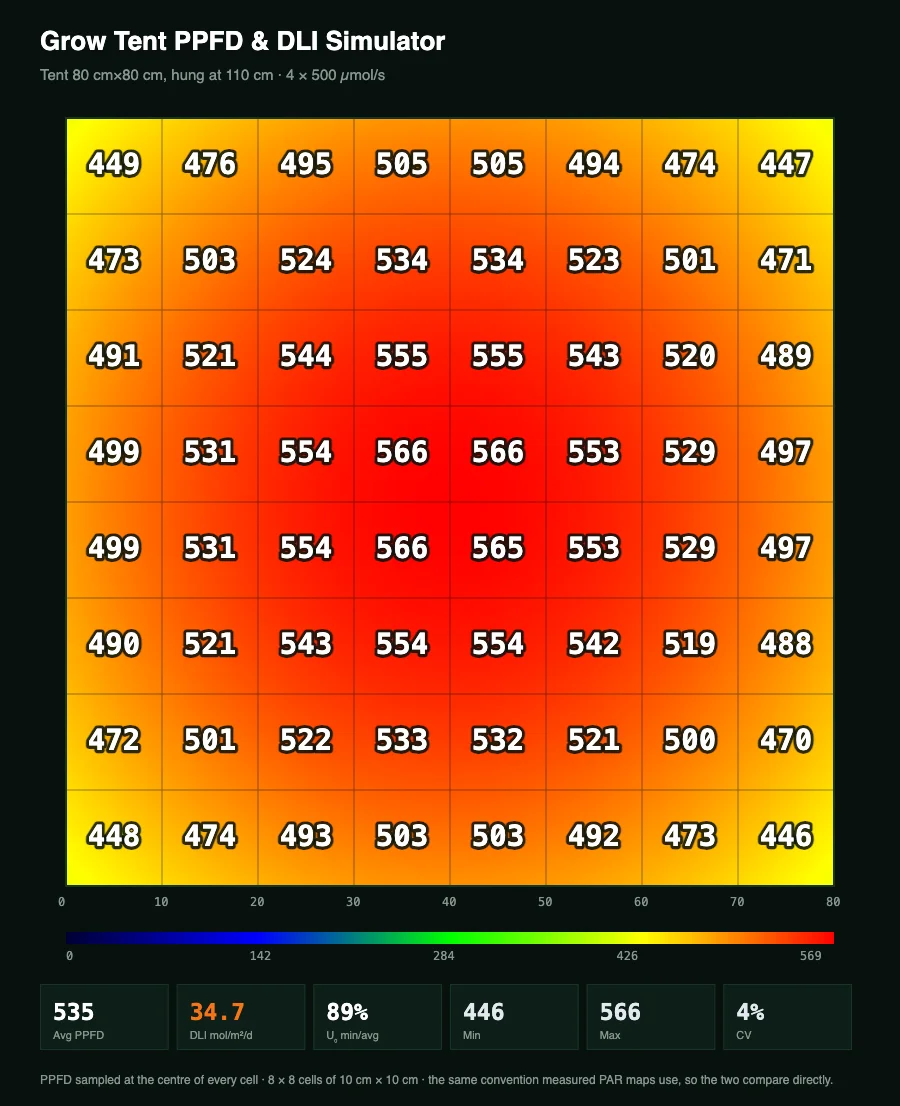
6. Turn on the PAR map if you want numbers rather than colour. Choose a 3×3, 4×4, 5×5 or 6×6 grid and the PPFD at the centre of every cell is written onto the floor, in the same form manufacturers publish.
7. Set the photoperiod and growth stage. The verdict then compares your PPFD and DLI against the range for that stage and says which one falls short.
Everything recalculates as you drag. The address bar carries the whole configuration, so you can paste a link into a forum thread and other people see exactly your setup.
Reading the numbers
Average PPFD is not the whole story. Two fixtures can deliver the same average and produce completely different results, because one lights the middle and starves the corners. That is what the uniformity figures are for.
U₀ = min/average is the definition used in EN 12464-1 and it is the strict one. Min/max is the ratio growers usually quote and it always reads worse. CV is the standard deviation over the mean — under 10% is tight coverage, over 20% is patchy.
The edge zone matters. Illuminance always collapses at the walls, so a band along the perimeter is excluded from the statistics. Include it and every sane setup fails uniformity. The default is 10 cm; widen it if your plants never sit against the wall.
The maintenance factor defaults to 1.00 so you see datasheet-new output first. Drop it to 0.90 to allow for LED depreciation and dust over a few cycles — that is what the fixture will actually deliver in a year.
PPFD chart: what each stage needs
A PPFD chart is only half an answer, because the same PPFD over a different photoperiod gives a different daily dose. Both columns matter.
| Stage | PPFD, µmol/m²/s | DLI, mol/m²/day | Typical photoperiod |
|---|---|---|---|
| Seedlings and clones | 100–300 | 6–15 | 18 h |
| Vegetative | 400–600 | 20–30 | 18 h |
| Flowering | 600–900 | 30–45 | 12 h |
Above roughly 900 µmol/m²/s the plant usually cannot use the extra photons without supplemental CO₂ — you are paying for electricity that does not become growth. The calculator flags this rather than silently rewarding a bigger number.
These ranges are widely used starting points, not a law of nature. Strain, temperature, nutrition and CO₂ all shift them.
PAR map: checking a manufacturer's numbers
A PAR map is a grid — usually 5×5 or 6×6 — with a PPFD figure in each cell, measured at one stated height over one stated footprint. Every serious fixture ships with one, and it is the single most useful thing on a spec sheet, because it shows the corners as well as the centre.
It is also the hardest claim to verify. The map was taken once, in a test rig, at a height that may not be yours, in a tent that may not be your size. You cannot re-measure it without a quantum sensor.
That is what the grid here is for. Enter the fixture's PPF and beam angle, set your own tent and your own hanging height, and the calculator writes a PPFD figure into every cell of the same kind of grid. Put the two side by side and the differences are immediately visible: whether the corners really hold up, what a different height would do, and whether the published footprint matches your tent.
Two things to keep in mind when comparing.
Values are sampled at the cell centre, which is how measured maps are made, so the two are directly comparable. A cell average would read slightly lower in the hot centre and slightly higher at the edges.
One is measured, the other modelled. A published map carries the fixture's real photometry; this one is built from a cosine-power distribution and the PPF you typed in. Agreement within 10–20% is a good result and means the spec sheet is plausible. A gap of two or three times means either the beam angle you entered is wrong or the claimed PPF is not what the fixture delivers.
PPFD to DLI
The conversion is arithmetic:
DLI = PPFD × hours × 3600 / 1,000,000PPFD is photons per square metre per second, so multiplying by the seconds of light in a day gives photons per square metre per day. The division by a million converts micromoles to moles.
A worked pair: 600 µmol/m²/s for 18 hours gives 600 × 18 × 3600 / 10⁶ = 38.9 mol/m²/day. The same 600 µmol/m²/s for 12 hours gives 25.9 — the same light, a third less daily dose, which is exactly why a flowering tent needs higher PPFD than a vegetative one to reach a comparable DLI.
The calculator does this for you from the photoperiod slider. If you want to work the conversion on its own, or go the other way and find the PPFD needed for a target DLI, the dedicated DLI calculator for plants↗ handles that case directly.
Where the numbers come from
Fixtures are treated as area sources, not points. This matters more than it sounds. A 60 cm panel hung 30 cm above the canopy is not a point source, and the inverse-square law only holds when the distance is several times the emitter size. Measured against a dense reference:
| Hanging height | Point-source model overestimates the peak by |
|---|---|
| 30 cm | 129% |
| 40 cm | 73% |
| 60 cm | 32% |
| 120 cm | 7% |
So the calculator subdivides each fixture into a grid of sub-emitters, and the count adapts to the height — 11×11 for a panel at 30 cm, 3×3 at 120 cm. That is exactly where the simple models go wrong, because low hanging is where growers actually hang.
Wall reflections are modelled, not multiplied. Mylar adds about 25% on average, and that is the magnitude the calculator delivers. But a flat ×1.25 would lift the centre and the corners equally and change uniformity not at all — which is not what a reflective liner does. Solving it by mirror images redistributes the light towards the edges, which is the actual point of lining a tent:
| Tent | U₀ without walls | U₀ with mylar |
|---|---|---|
| 60×60 | 76.1% | 83.7% |
| 120×120 | 41.3% | 55.2% |
| 240×120 | 24.1% | 36.3% |
Distribution follows a cosine-power law, I(θ) = I₀·cos^m θ, with m derived from the beam angle you enter. Total flux is conserved exactly — the integral of PPFD over the floor equals the PPF you typed in, minus what escapes past the walls.
What this is not
It is an engineering estimate for planning and comparison, not a photometric measurement. Real fixtures have measured photometry that a single formula cannot reproduce, and a quantum sensor in your own tent is still the final word. Use this to choose between layouts, decide a hanging height, and see whether a fixture can plausibly cover your footprint — not to certify a number.
Three results that look wrong but are not
Raising the light lowers PPFD but improves uniformity. Both are true at once, and the trade-off is the whole job. Hanging closer buys peak intensity at the cost of a hot centre and dark corners.
A long bar makes a nearly round pool. Physical length barely stretches the footprint: at typical hanging heights the pool is already wider than the bar is long, so a 1.5 m body gives an aspect ratio of about 1.10. Real elongation comes from the optics — set different angles per axis and the same bar produces around 1.49.
Total PPF divided by floor area is always higher than the average PPFD. Some photons hit the walls, some leave through the top of the tent. A realistic capture is 75–90%: four bars of 250 µmol/s in a 120×120 tent at 45 cm give an average of 607 µmol/m²/s against a theoretical 694 — about 87%.
Frequently asked
My fixture is rated in watts. What do I enter? Watts tell you the electricity bill, not the light. Divide the PPF by the wattage to get efficacy: a good modern LED sits at 2.5–3.0 µmol/J, so a 150 W fixture at 2.7 µmol/J emits about 405 µmol/s. If the seller quotes no PPF at all, treat that as information about the seller.
The datasheet gives lux, not PPFD. Can I convert? Only approximately, and only if you know the spectrum — lux is weighted for the human eye, which is nearly blind to the deep red that plants use. A full-spectrum white LED converts at roughly 0.015 µmol/m²/s per lux, but a blurple fixture is nowhere near that. The lux to PPFD calculator↗ covers the conversion and its limits, and it is also what to use if you are measuring with a phone app or a cheap lux meter rather than a quantum sensor.
Why not just use a general lighting calculator? Because lumens and lux are photometric units built around human vision, and photosynthesis does not share that response curve. A room lighting calculator answers a different question well — if that is what you need, the indoor lighting calculator to EN 12464-1↗ handles offices, workshops and warehouses with the standard's targets and glare limits. For plants, PPFD is the unit that matters.
How many bars should I use? More bars over the same footprint almost always beats one central panel of the same total PPF, because uniformity improves sharply. The calculator makes this comparison directly: set one panel, note U₀, then switch to four bars at the same total flux and compare.
Does it work on a phone? Yes. The 3D view rotates by dragging and zooms by pinching, and the layout reflows to a single column. There is a PNG export that produces a shareable card with the map and the key numbers.
Related tools
- Lux to PPFD calculator↗ — for turning a lux meter reading into something a plant cares about.
- DLI calculator for plants↗ — daily light integral on its own, in both directions.
- Indoor lighting calculator to EN 12464-1↗ — the same approach applied to rooms, with illuminance, uniformity and glare.